
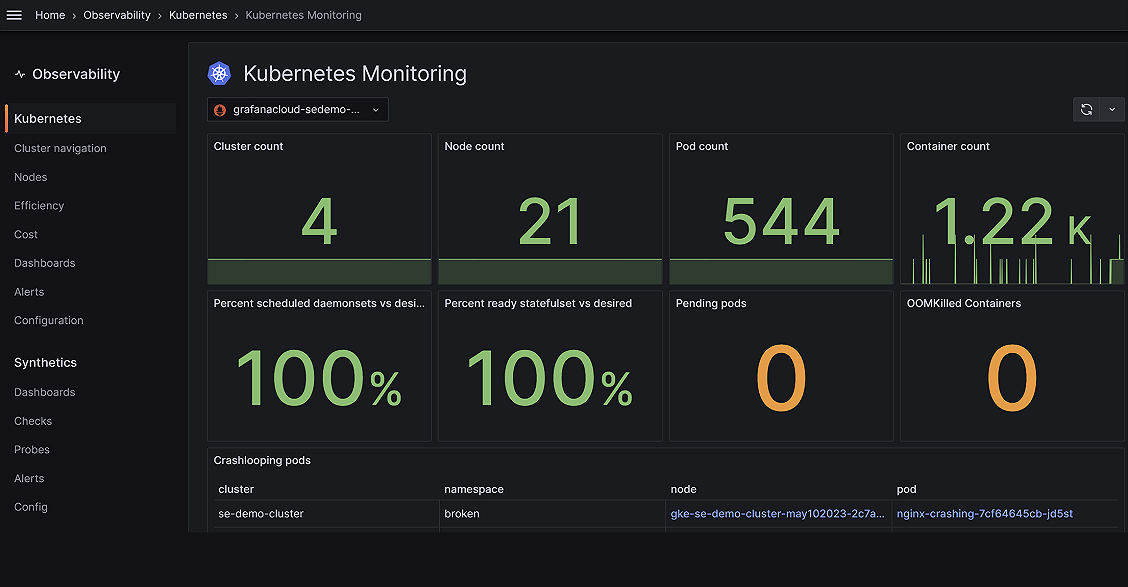
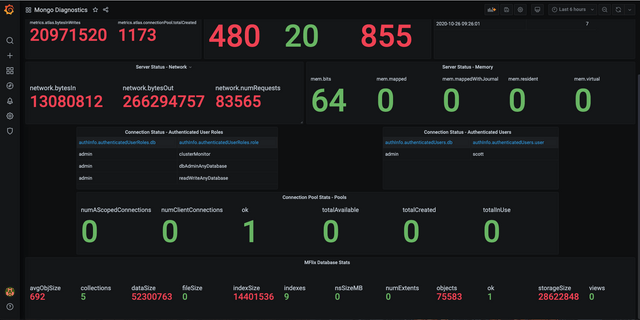
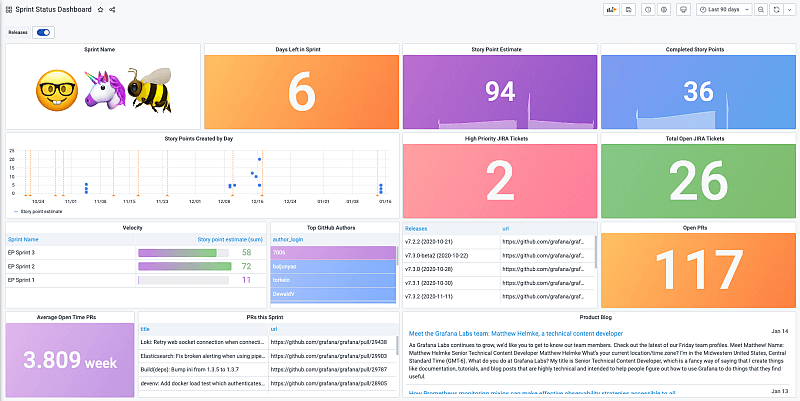
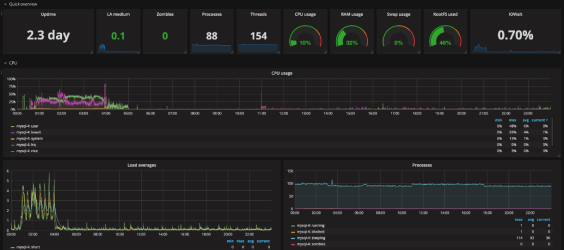
Grafana dashboards
From heatmaps to histograms, graphs to geomaps: fast and furious visualizations any way you want.

Featured
Loading...
No results found. Please clear one or more filters.
No results found. Please clear one or more filters.
AxiosError: Network Error
Grafana Cloud
Free forever plan
(Surprise: it’s actually useful)- Grafana, of course
- 50 GB traces
- 10k series Prometheus metrics
- 500 VUh k6 testing
- 50 GB logs
- 30 OnCall notifications
Create free account
No credit card needed, ever.
Filters:
Data Source
Panel
Collector Types
Sort by
Category
Share your dashboards
Export any dashboard from Grafana 3.1 or greater and share your creations with the community.

Registration is open! Join us in a city near you to preview new LGTM Stack features, attend technical deep dive sessions, and leave with what you need to advance your observability roadmap.
Grafana Cloud
- Grafana, of course
- 10k series Prometheus metrics
- 50 GB logs
- 50 GB traces
- 2,232 app o11y host hours
- ...and more
Create free account
No credit card needed, ever.
Introducing
Frontend Observability
Our hosted service for real user monitoring. Gain precise, end-to-end user insights.
- Reduce metric cardinality by 30-50%
- Pay only for metrics you use
- Centralize control over your data in Grafana Cloud
Gain insight into unused metrics and optimize metric cardinality with the new cardinality management dashboards and Adaptive Metrics
Chicago, Mar 11
Grafana Cloud demos. Community success stories. Advance your observability roadmap.
Join Us
