
Uptime robot
Visualise uptimerobot.com infos : down, up, paused monitors, response time, psp, ...
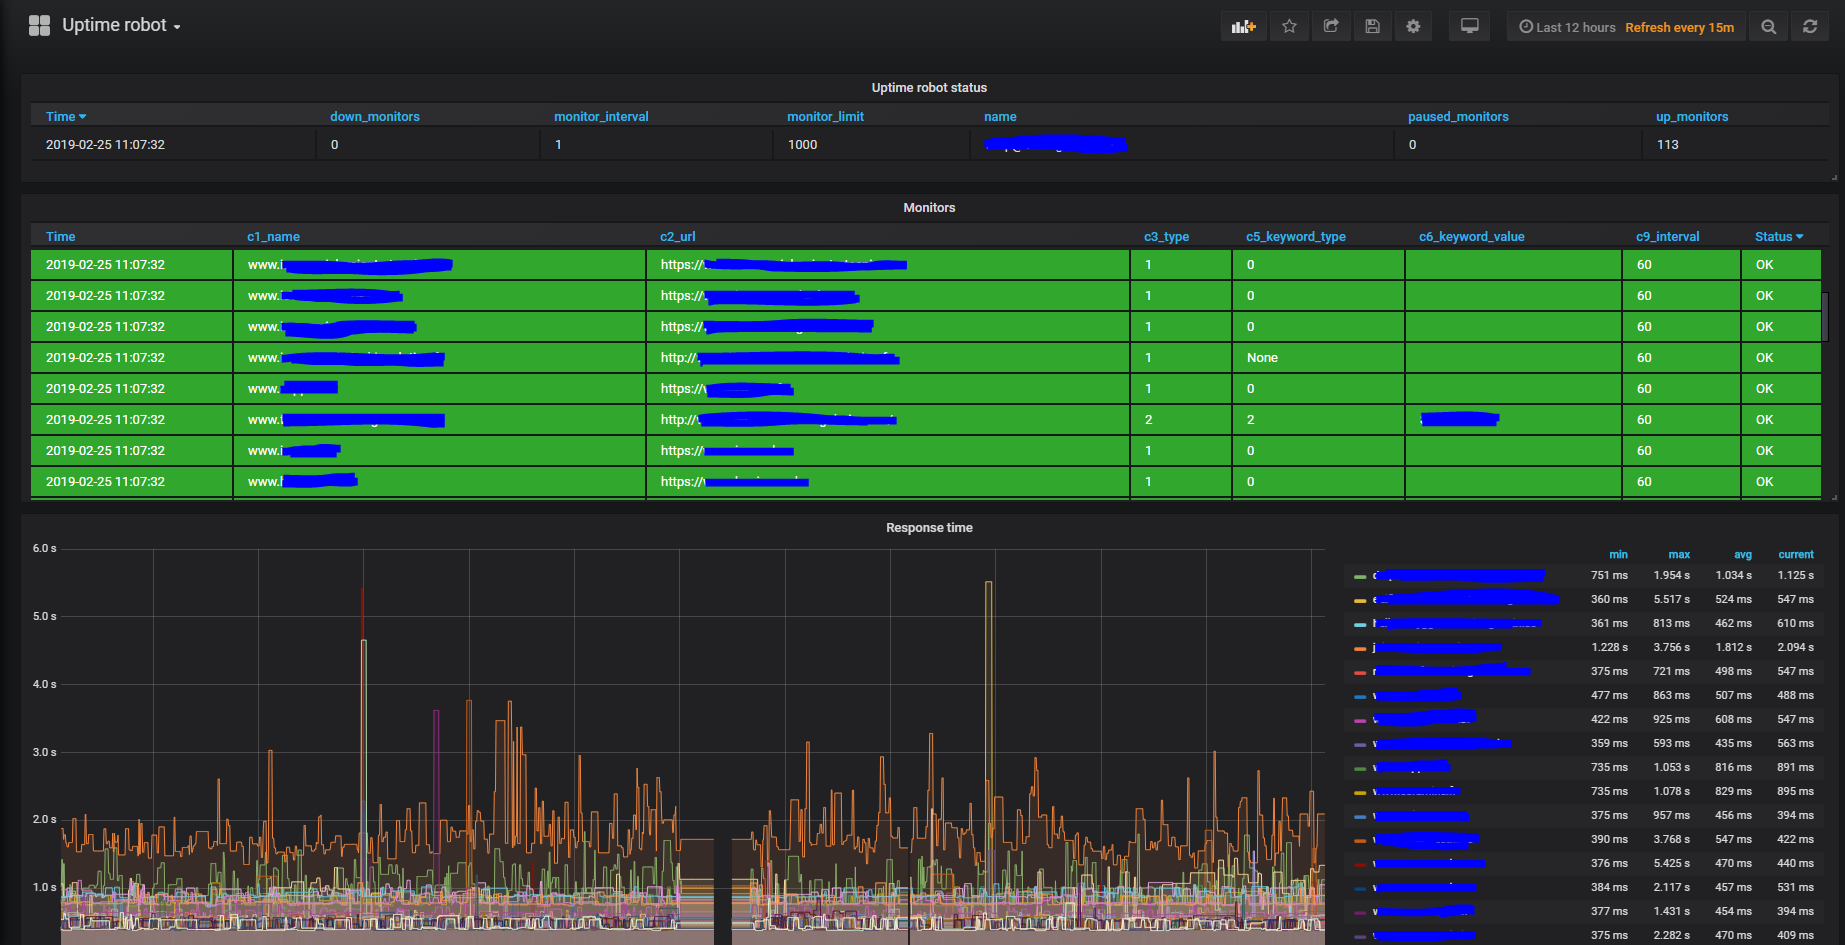
It use uptimerobot_exporter to expose infos from your uptimerobot.com account for Prometheus. It provide :
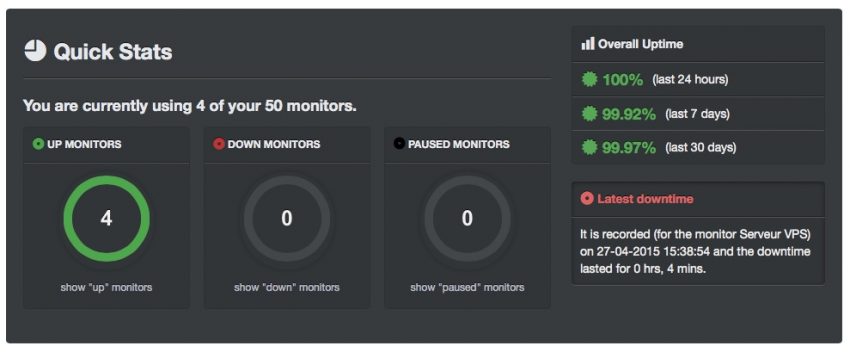
- number of down monitors : down_monitors
- number of up monitors : up_monitors
- number of paused monitors : paused_monitors
- Maximum monitor : monitor_limit
- Monitor status (Monitors) : name, url, type, [keyword], [keyword_value], interval, status (color change with status)
- Responste time : Minimum (min), maximum (max), average (avg) and current
- public status page (psp)
Docker
docker run -d --name uptimerobot_exporter -e 'UPTIMEROBOT_API_KEY=your_uptime_robot_api_key' -p 9705:9705 --read-only lekpamartin/uptimerobot_exporterif you don’t use docker run the python script :
python3 files/exporter.pyPrometheus
Add the target
Grafana
- import dashboard (id 9955)
- Add prometheus datasource (name Prometheus)
More informations
Data source config
Collector type:
Collector plugins:
Collector config:
Revisions
Upload an updated version of an exported dashboard.json file from Grafana
| Revision | Description | Created | |
|---|---|---|---|
| Download |
Get this dashboard
Resources