Varnish
A dashboard to use to debug a running varnish instance. Easily track requests, cache hits, network i/o, sessions, threads, bans, ban lurker and the ban list size
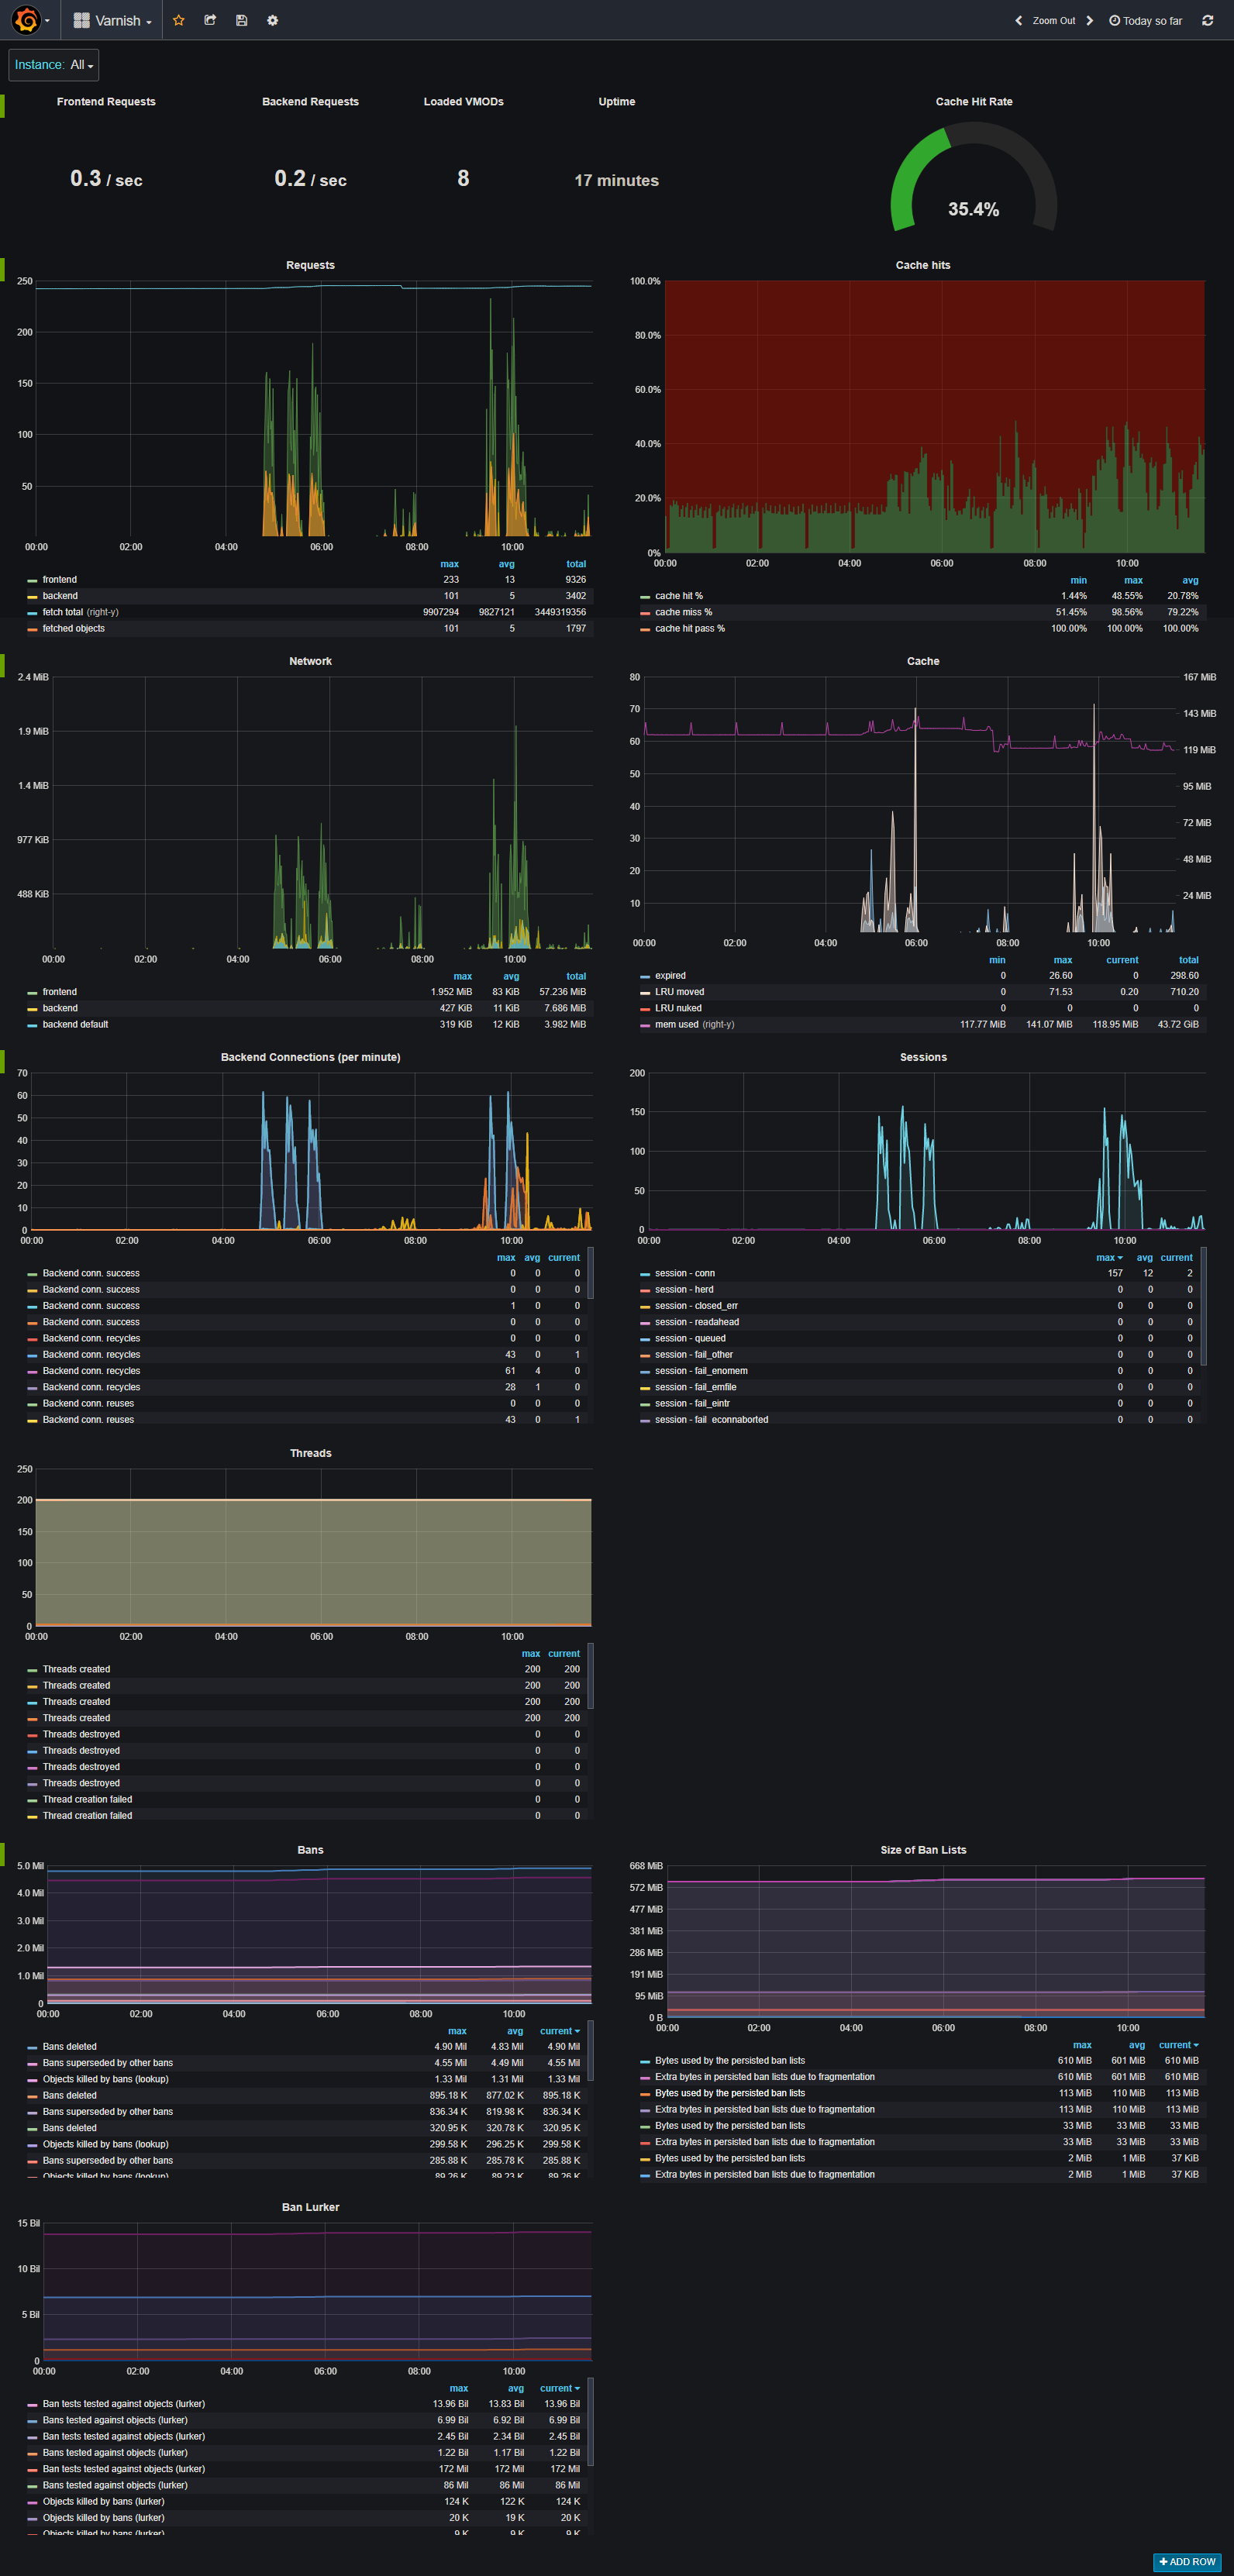
A dashboard to use to debug a running varnish instance. Easily track requests, cache hits, network i/o, sessions, threads, bans, ban lurker and the ban list size.
For use with the exporter below. https://github.com/jonnenauha/prometheus_varnish_exporter
Data source config
Collector type:
Collector plugins:
Collector config:
Revisions
Upload an updated version of an exported dashboard.json file from Grafana
| Revision | Description | Created | |
|---|---|---|---|
| Download |
Varnish Cache
Easily monitor Varnish Cache, an open source web application accelerator, with Grafana Cloud's out-of-the-box monitoring solution.
Learn more