
Windows & Tomcat Overview
Windows host dashboard + Tomcat metrics for telegraf metrics pumped into Prometheus
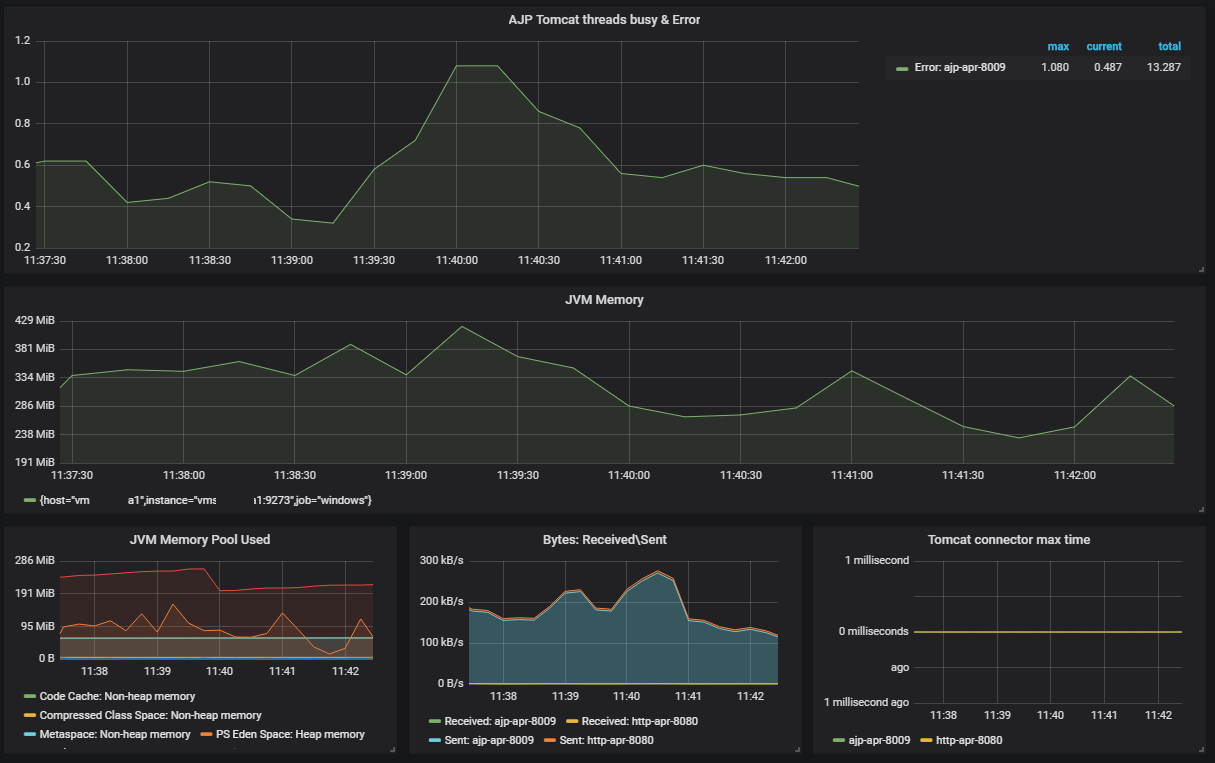
Dashboard for basic Windows, JVM and Tomcat metrics collected with Telegraf and Prometheus.
Please specify variables with in config template To get process name for this string "Instances = ["javaw", "java", "httpd",""]" please use cmd > tasklist
Data source config
Collector type:
Collector plugins:
Collector config:
Revisions
Upload an updated version of an exported dashboard.json file from Grafana
| Revision | Description | Created | |
|---|---|---|---|
| Download |
Apache Tomcat
Easily monitor Apache Tomcat, an open source web server and servlet container that can run Java-based web applications, with Grafana Cloud's out-of-the-box monitoring solution.
Learn more