
Windows & Tomcat Overview
Windows host dashboard + Tomcat metrics for telegraf metrics pumped into Prometheus
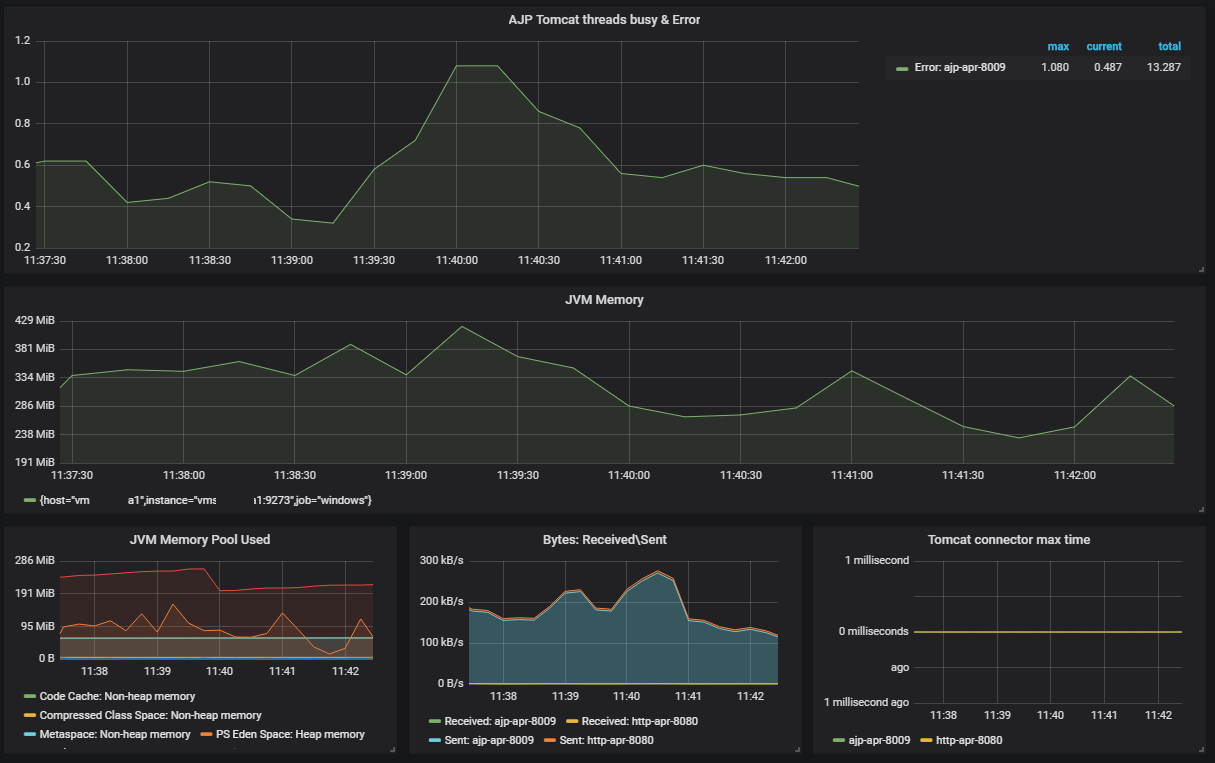
Dashboard for basic Windows, JVM and Tomcat metrics collected with Telegraf and Prometheus.
Please specify variables with
Data source config
Collector type:
Collector plugins:
Collector config:
Dashboard revisions
Upload an updated version of an exported dashboard.json file from Grafana
| Revision | Decscription | Created | |
|---|---|---|---|
| Download |
Sign up for Grafana Cloud

Get up and running in minutes with the Grafana Cloud free tier, which includes free forever 10k metrics, 50GB logs, 50GB traces, 500 VUh, and more.
Get this dashboard
Data source:
Dependencies: