NJMON / NMON : AIX Individual Server Statistics
Performance stats of individual server with drop down menu from influxdb source and njmon input. Comments, corrections and suggestions welcome
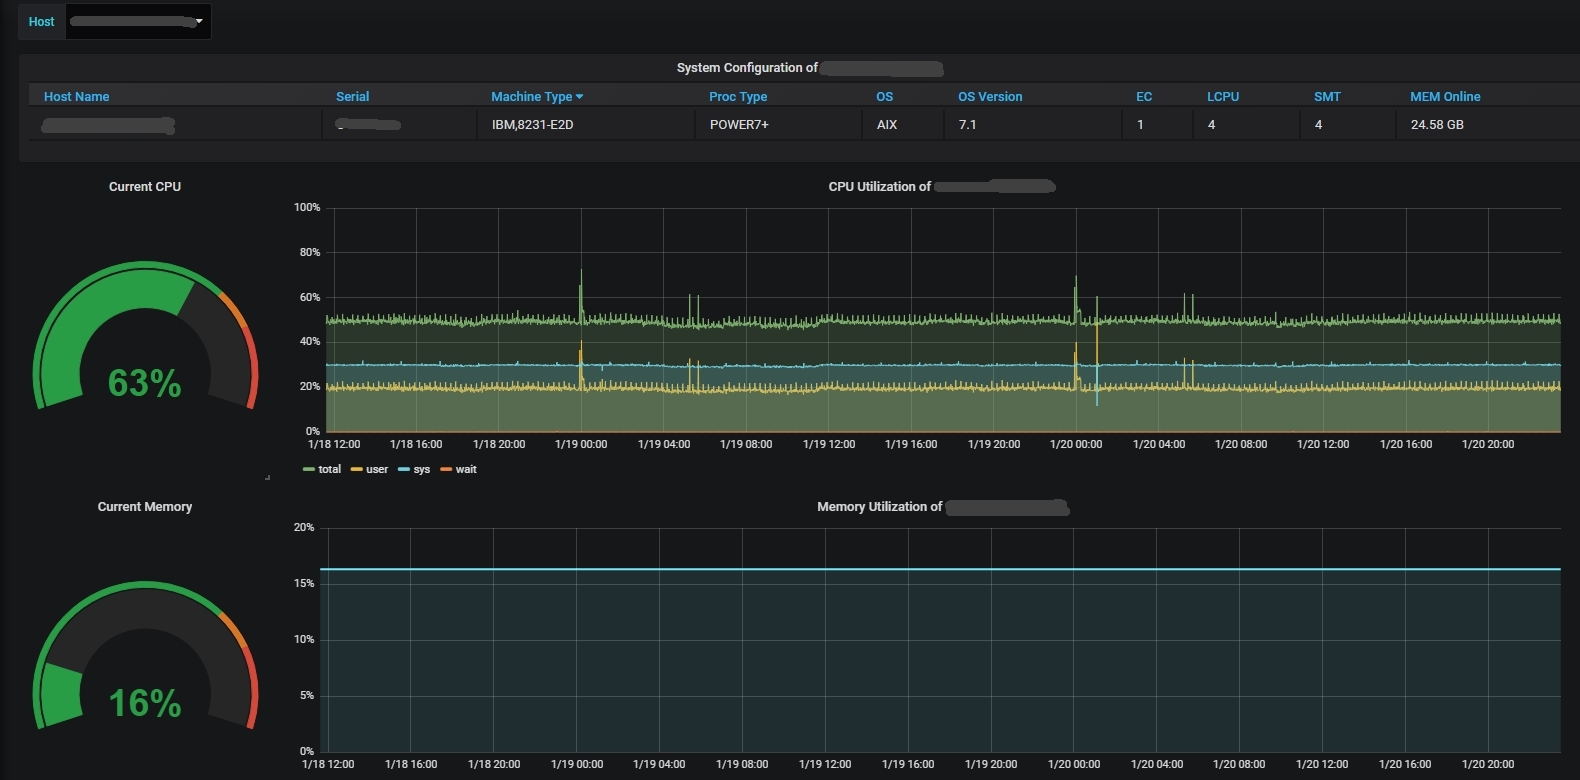
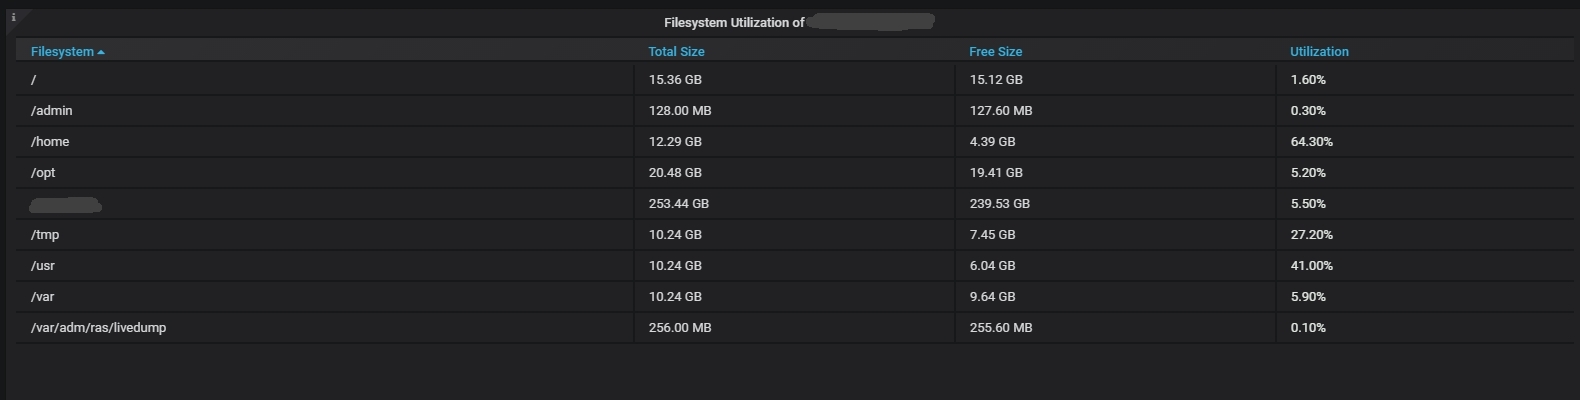
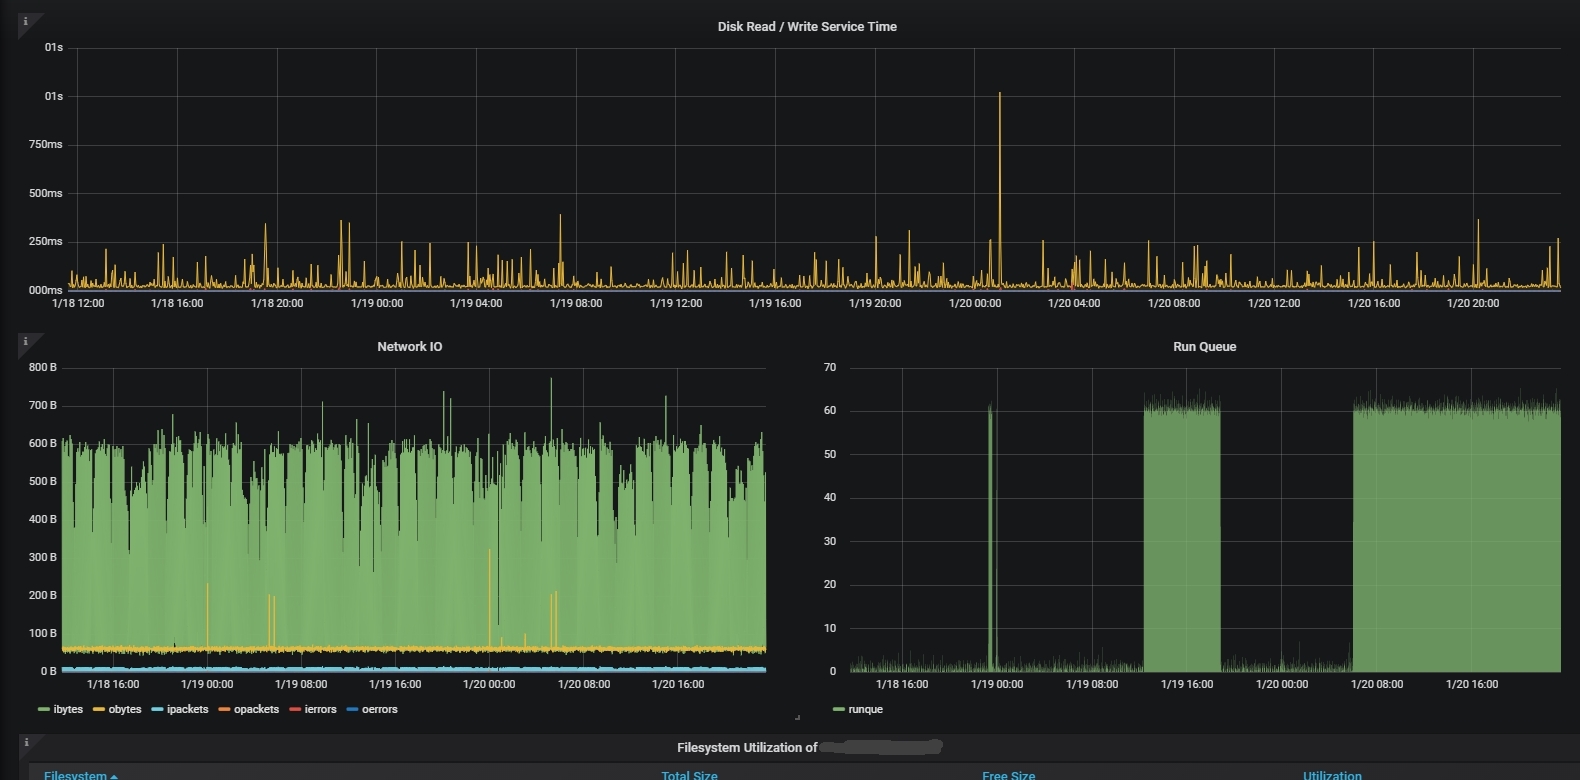
This dashboard is created to provide front end for njmon statistics collected in AIX servers. This dashboard provides a drop drown menu where user can select individual server to display statistics of selected host. Influxdb is used as the data source for this dashboard. Feel free to modify this dashboard. Measurements displayed includes ‘LPAR config’, ’CPU utilization’, ’Memory utilization’, ’Paging utilization’, ’Network IO’, ’Runqueue’ and ’Filesystem utilization’. *more tabs to be added in future. *njmon logo belongs to Mr.Nmon.
Data source config
Collector config:
Upload an updated version of an exported dashboard.json file from Grafana
| Revision | Description | Created | |
|---|---|---|---|
| Download |