EdgeFS Cluster
Multi-cloud era filesystem for geo-transparent data access.
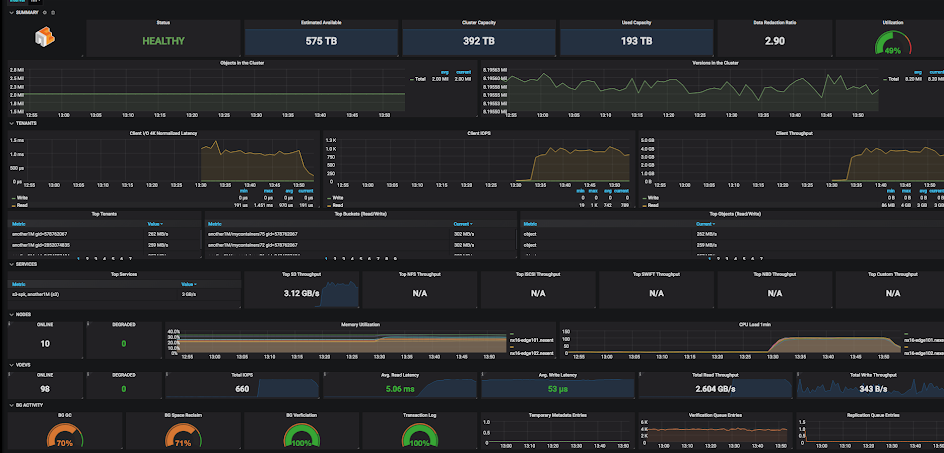
EdgeFS designated management server (aggregator) exposing post-filtered metrics in format compatible with Prometheus "pull" model. It listens on port 8881 by default. To verify if metrics works, run the following command on aggregator node (or use proper IP address in case of Docker / K8s deployment): curl localhost:8881/metrics Prometheus service periodically scrapes this URL and pulls statistics into its own time series database. Grafana dashboard configured with Prometheus data source and displays metrics in a nice presentable way.
Data source config
Collector type:
Collector plugins:
Collector config:
Revisions
Upload an updated version of an exported dashboard.json file from Grafana
| Revision | Description | Created | |
|---|---|---|---|
| Download |