Alertmanager告警总览
Dashboard showing Prometheus Alertmanager metrics for observing status of the cluster and possible debbuging. AlertManager告警总览
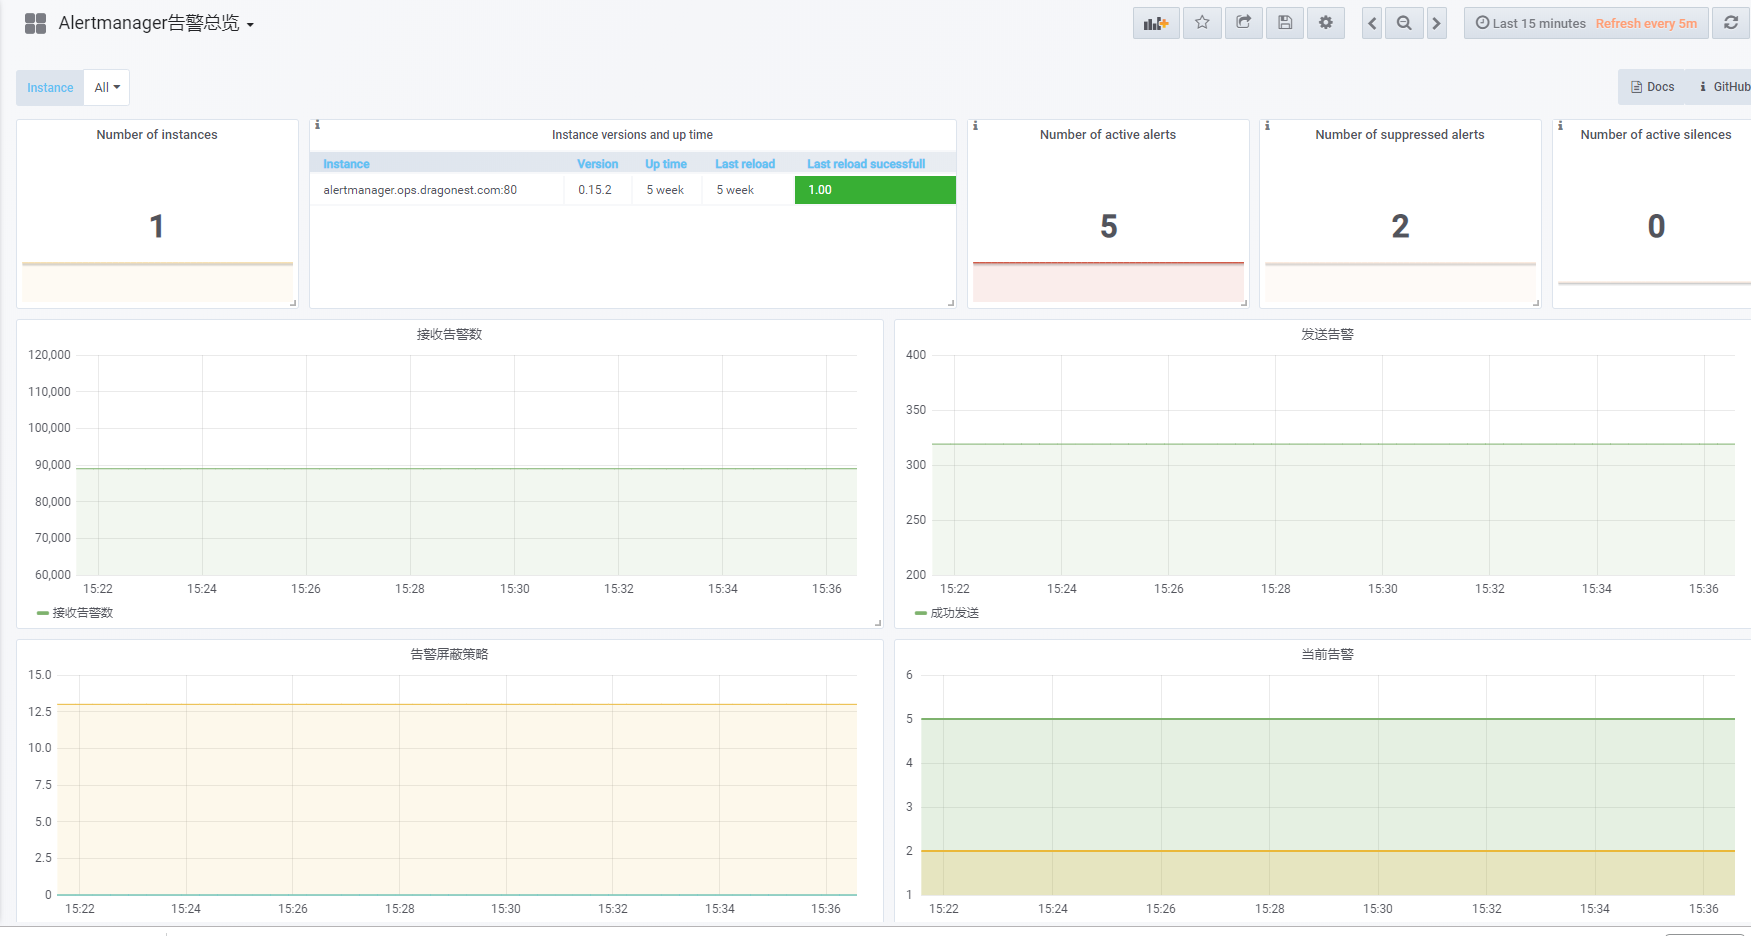
AlertManager告警总览面板
Data source config
Collector type:
Collector plugins:
Collector config:
Revisions
Upload an updated version of an exported dashboard.json file from Grafana
| Revision | Description | Created | |
|---|---|---|---|
| Download |