Lustre jobstats
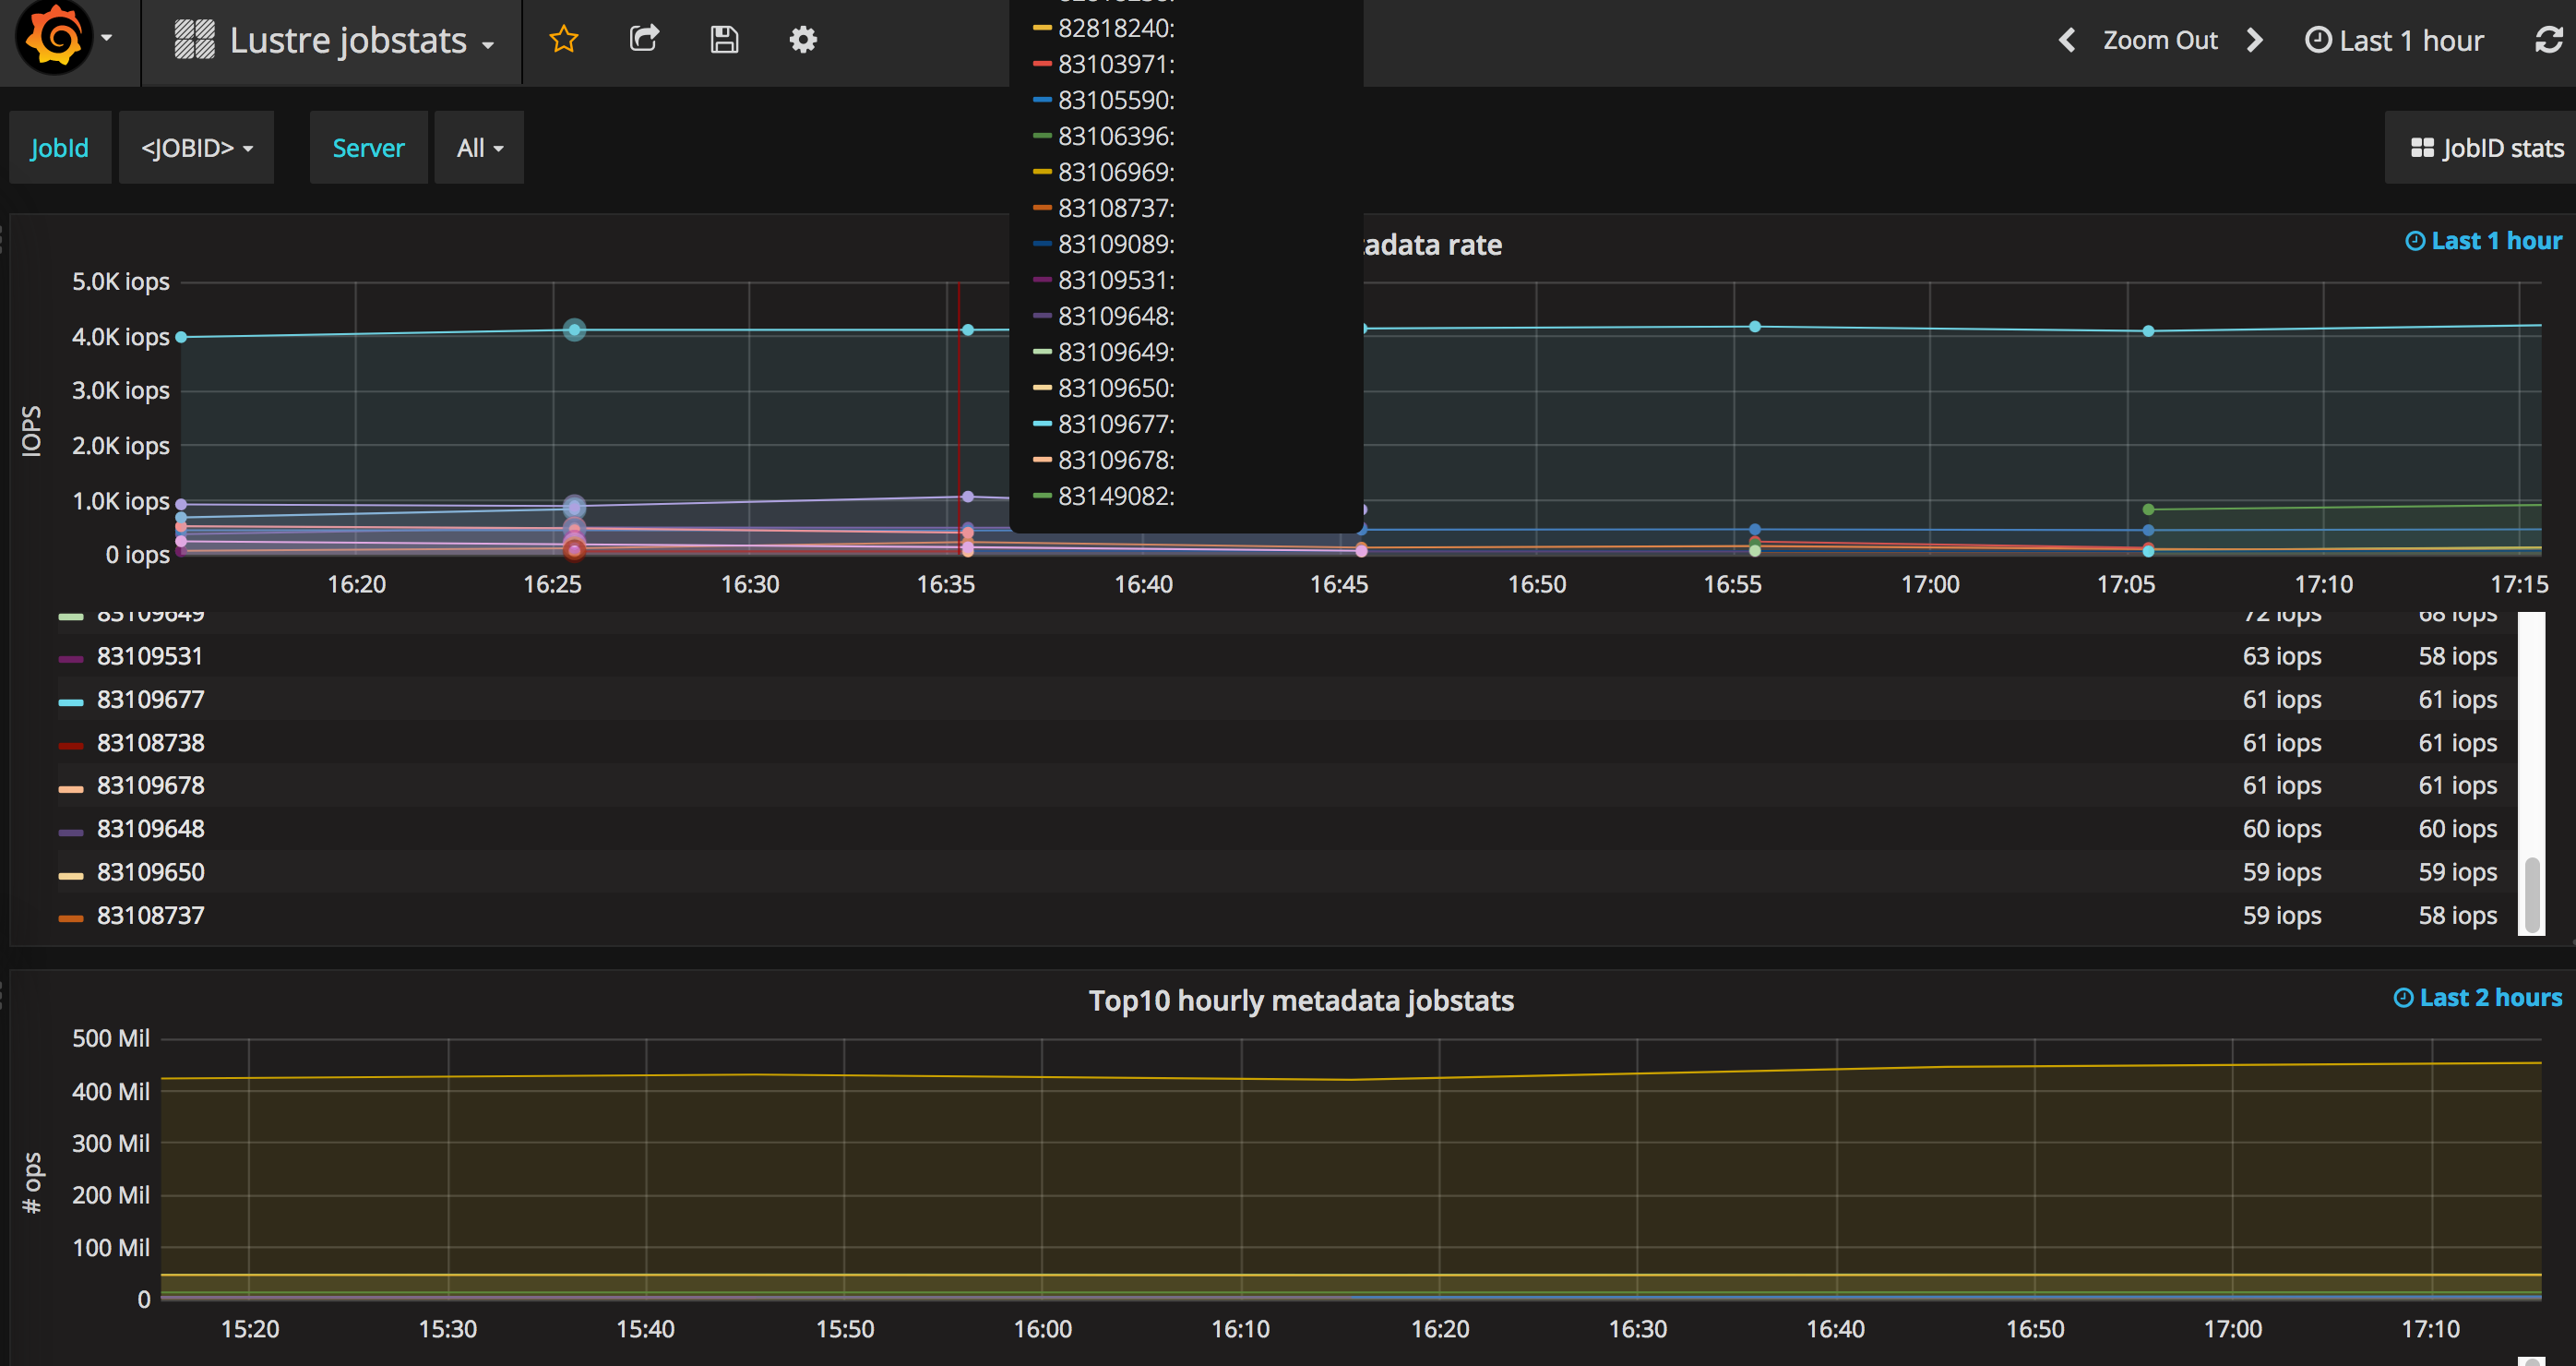
Lustre jobstats dashboard with 4 panels and a link to a dashboard with the details of the one particular job selected in this panel (see below):
- Top 10 metadata rate jobstats
- Top10 hourly metadata jobstats
- Top20 data rate jobstats
- Top20 hourly aggregated jobstats
Notes:
- Depending on the number of job IDs and the processing capacity of prometheus the jobstats panels might time out. If this is the case try to reduce the granularity or use any other pre-processing aggregation for jobstats. The time picker in this dashboard is extremely important in order to have a running query not timing out.
- The link on this dashboard needs to be edited with your Grafana server address. It will also need the dashboard for the detailed jobstat view which we're also uploading.
Data source config
Collector config:
Upload an updated version of an exported dashboard.json file from Grafana
| Revision | Description | Created | |
|---|---|---|---|
| Download |

