Lustre detailed
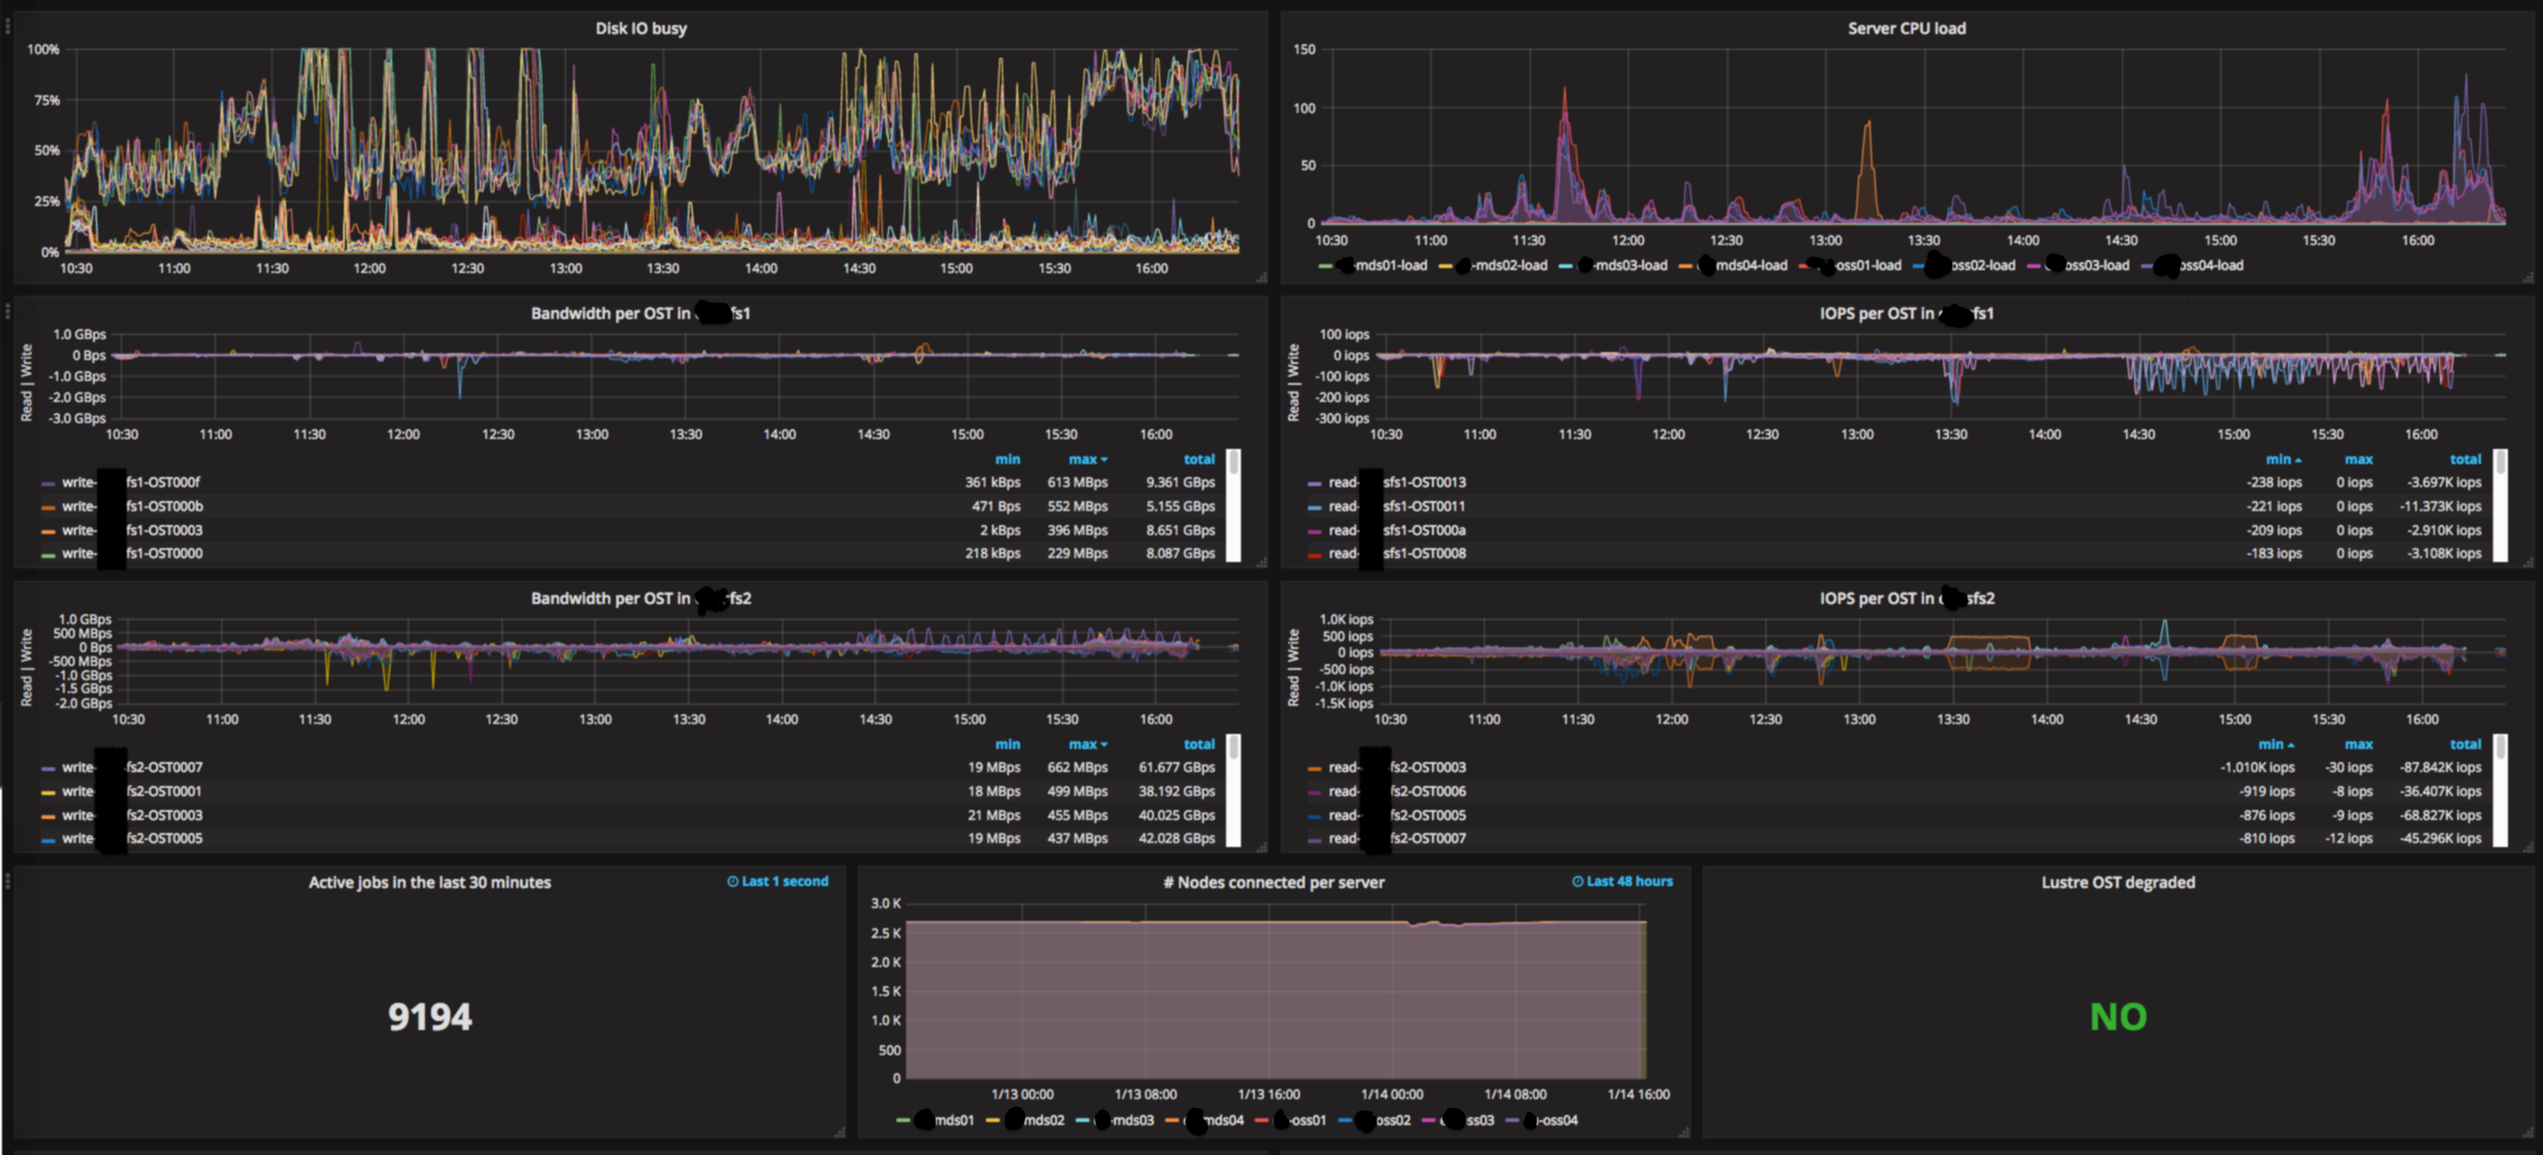
Lustre advanced dashboard supporting more than 1 Lustre filesystem. This dashboard is intended for those that won't have enough with dashboard "Lustre overview" (9658). We have also uploaded other metrics with detailed jobstats dashboards. The following information is provided in addition to the information provided by Lustre overview:
- Metadata operations per MDT
- IO bandwidth per OST
- IOPS per OST
- % Disk IO busy as per block device stats
- LNET rate
- LNET messages
- DIsk IO size ratio
- MDS available memory
- OSS available memory
- MDS detailed memory usage
- OSS detailed memory usage
Data source config
Collector config:
Upload an updated version of an exported dashboard.json file from Grafana
| Revision | Description | Created | |
|---|---|---|---|
| Download |

