Lustre Overview
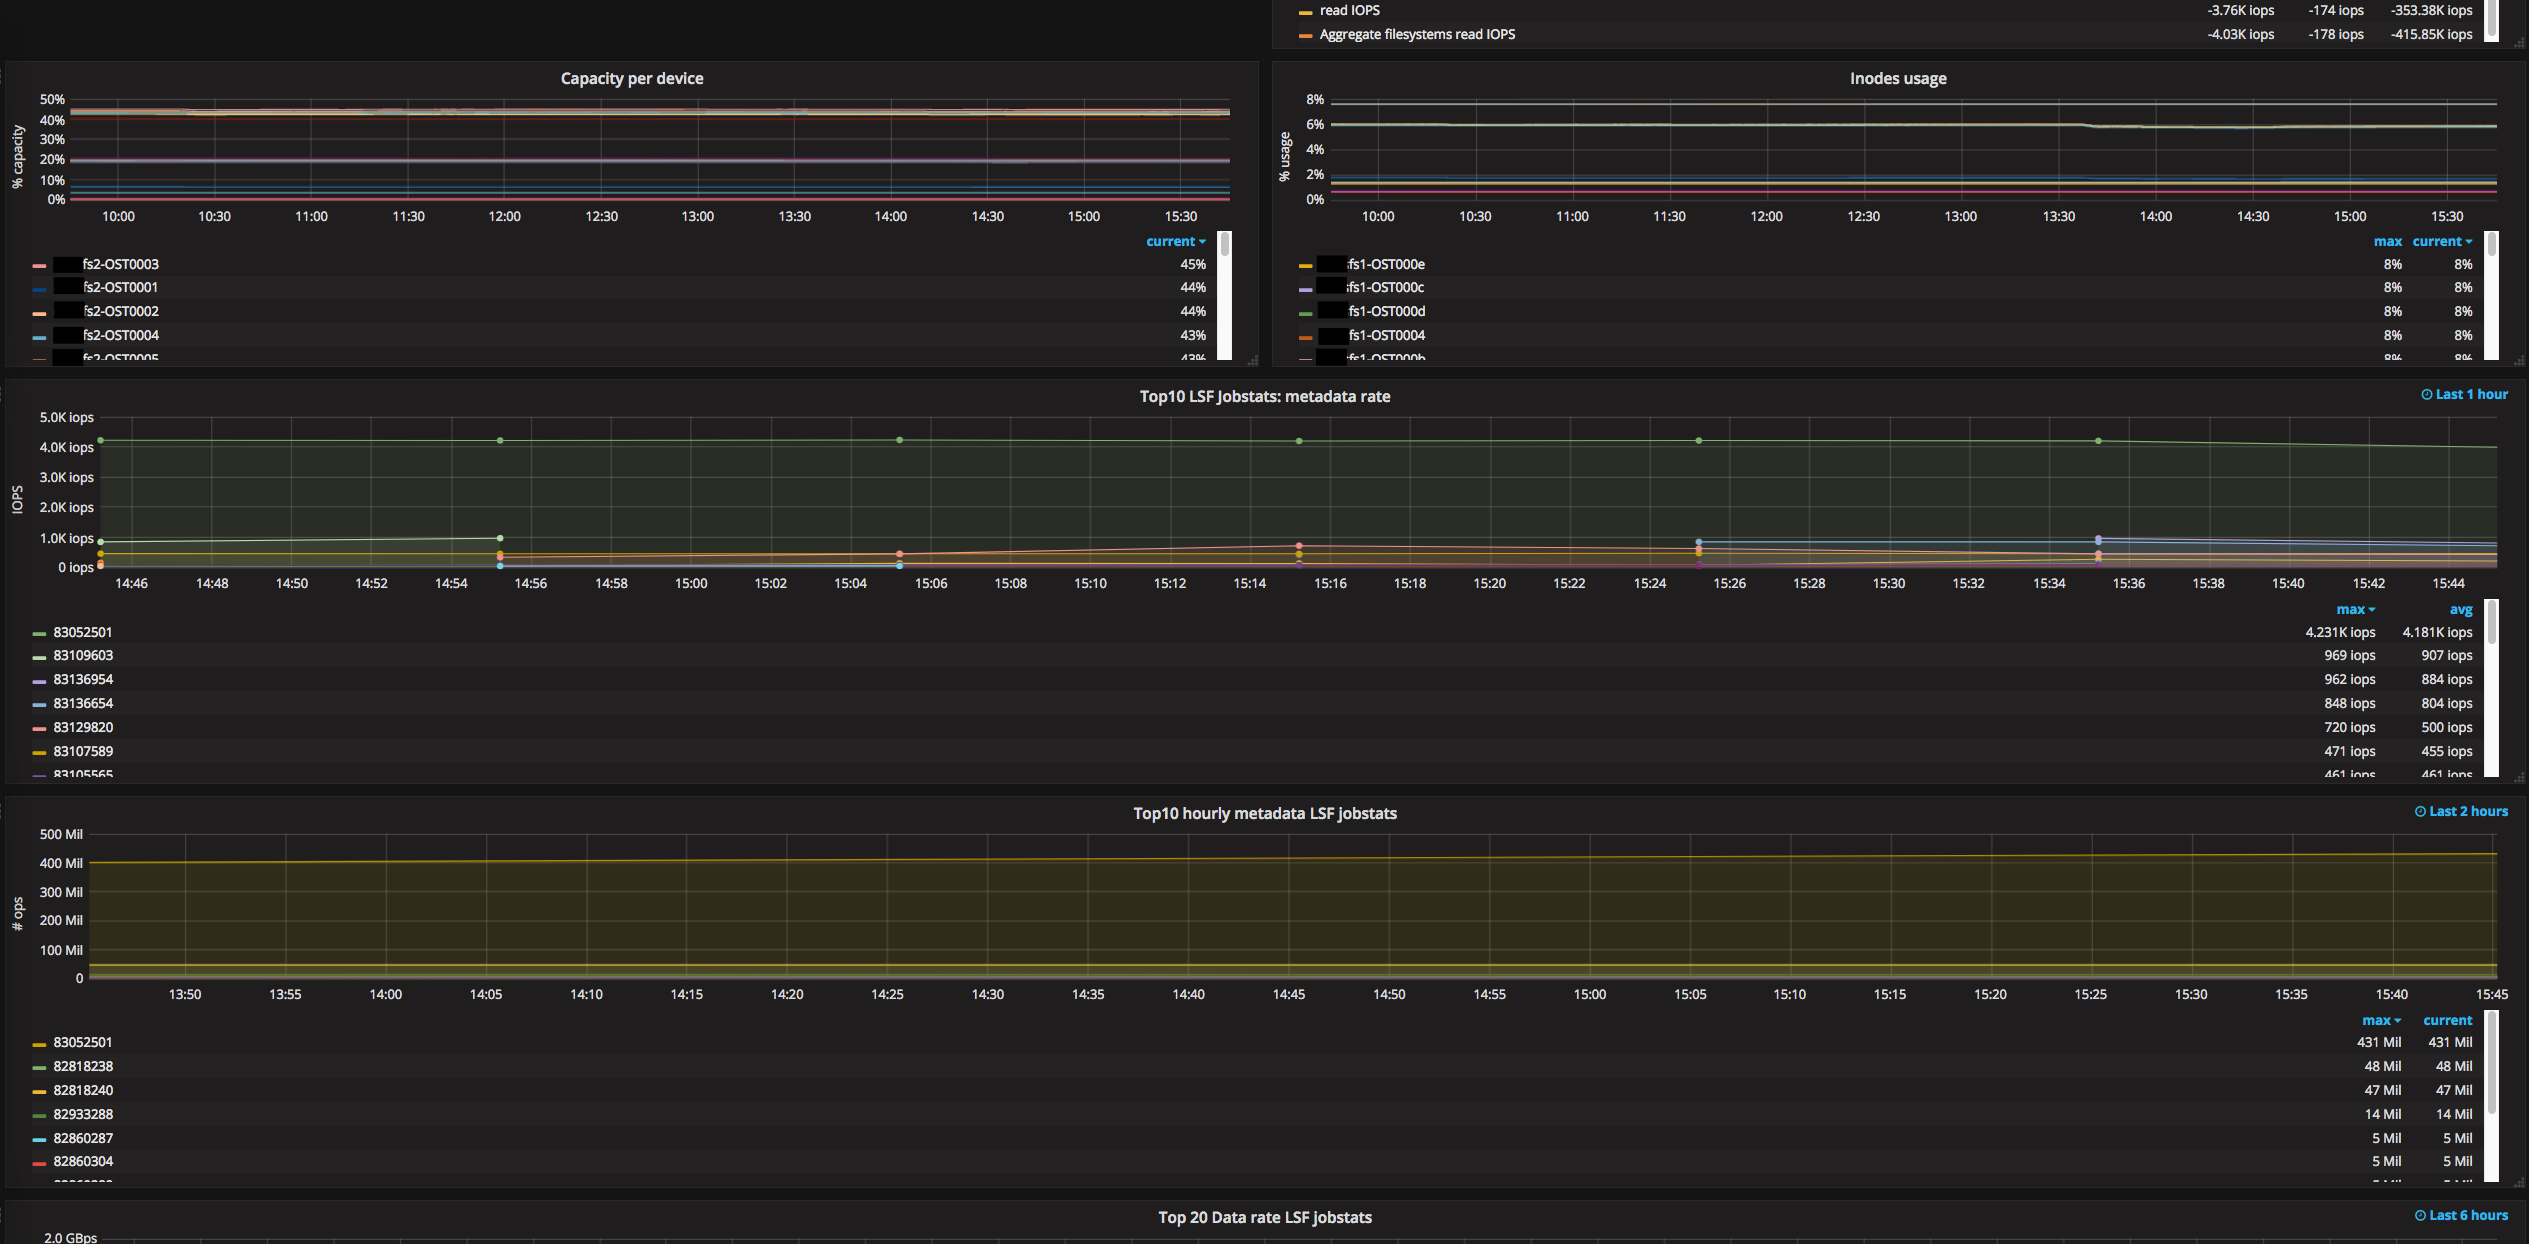
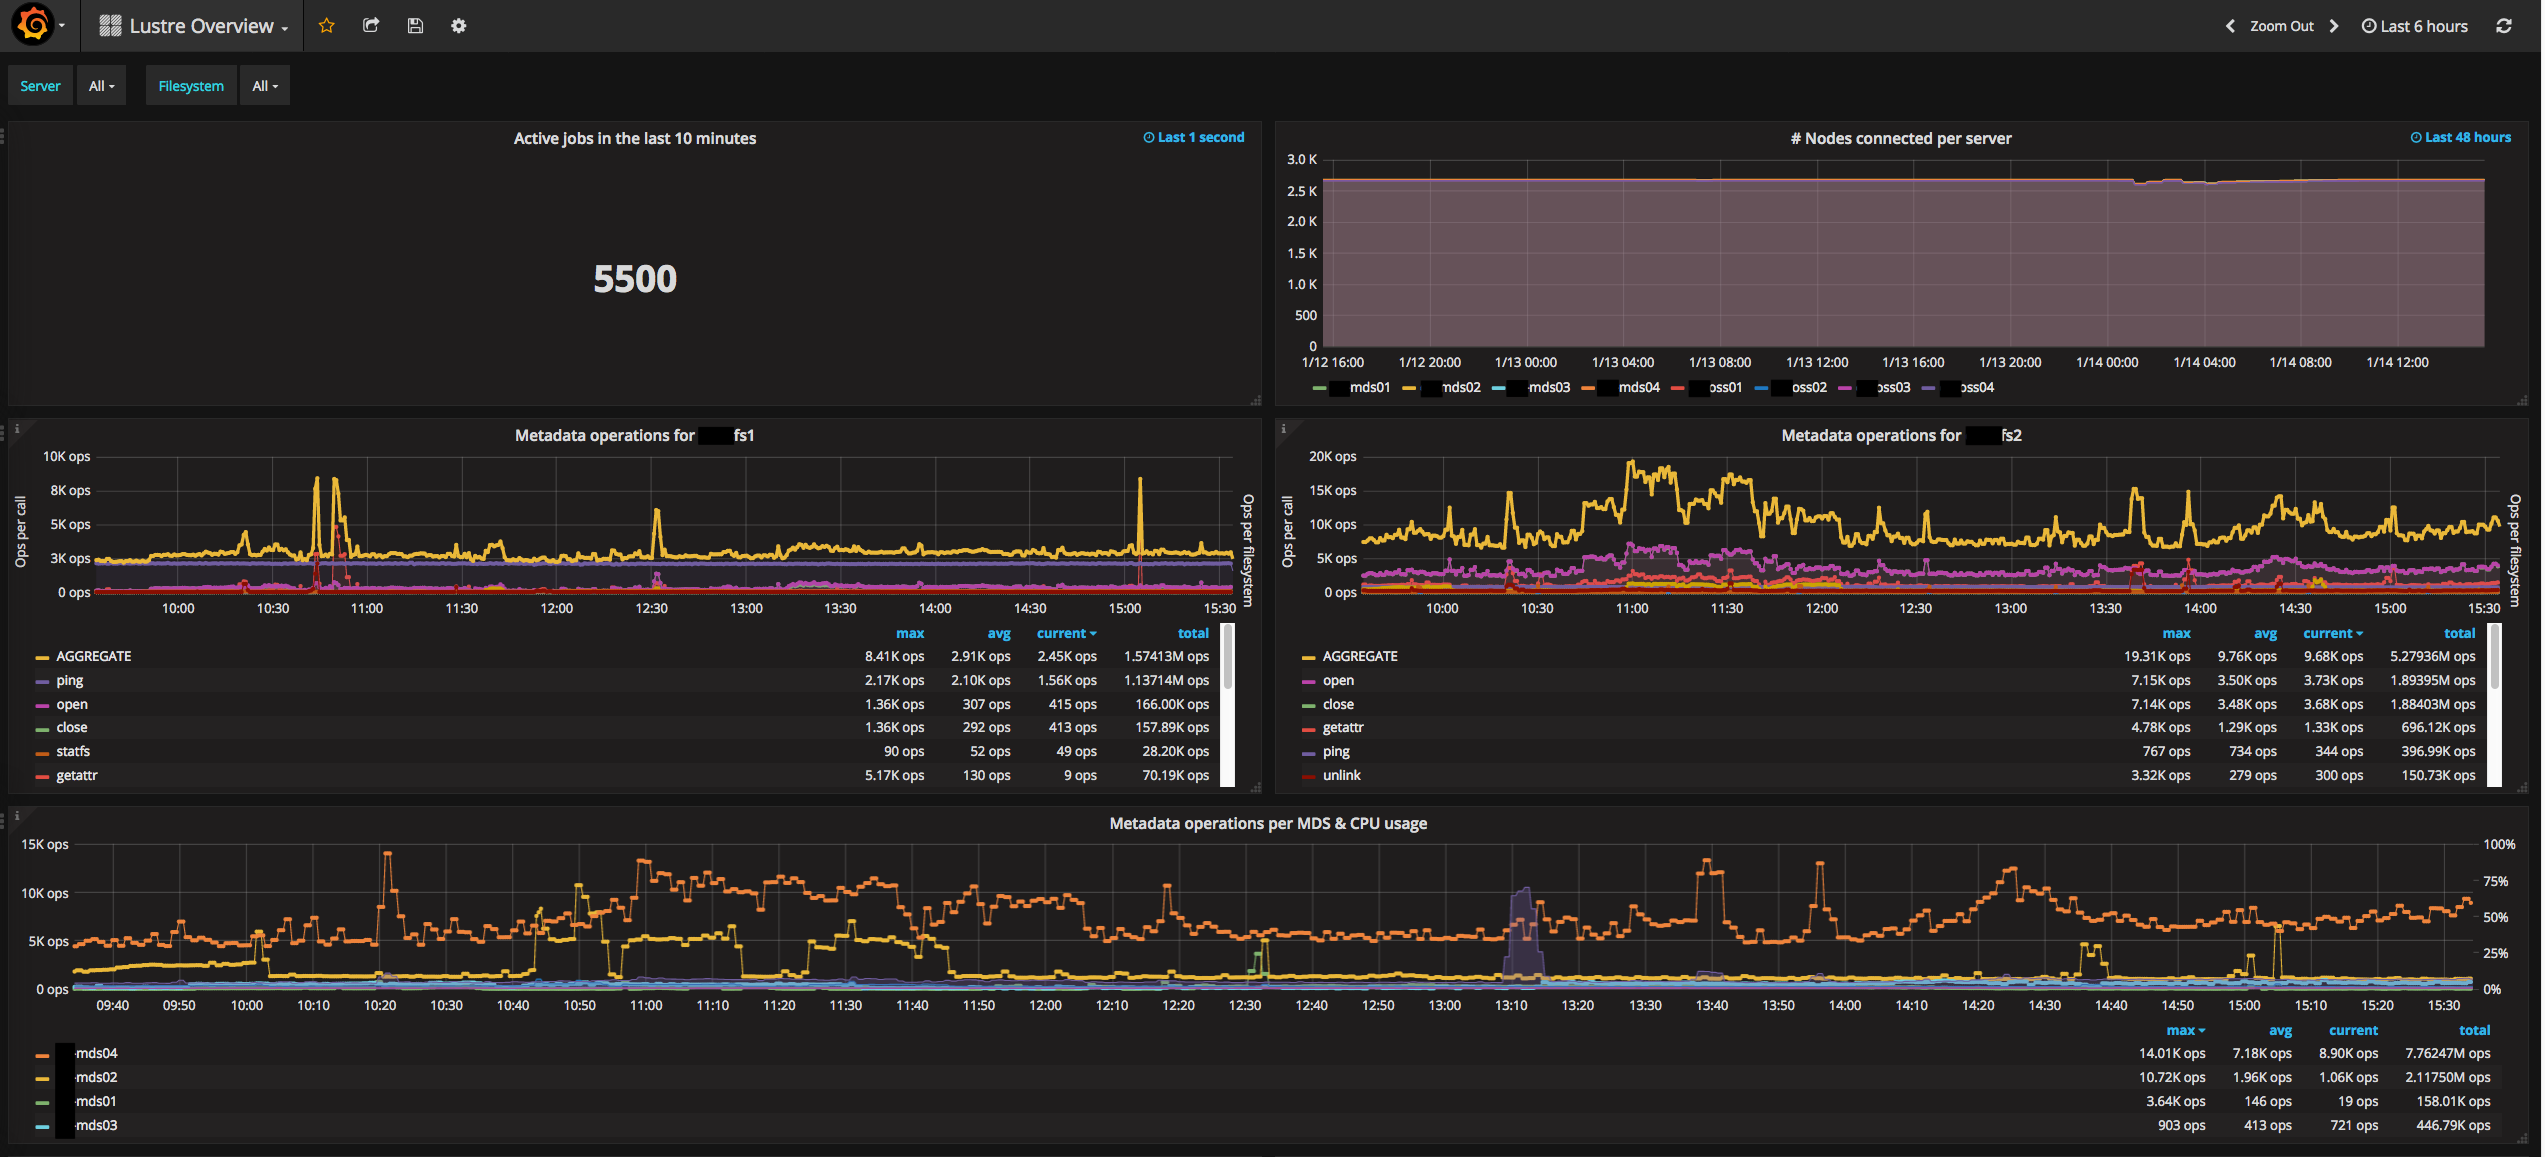
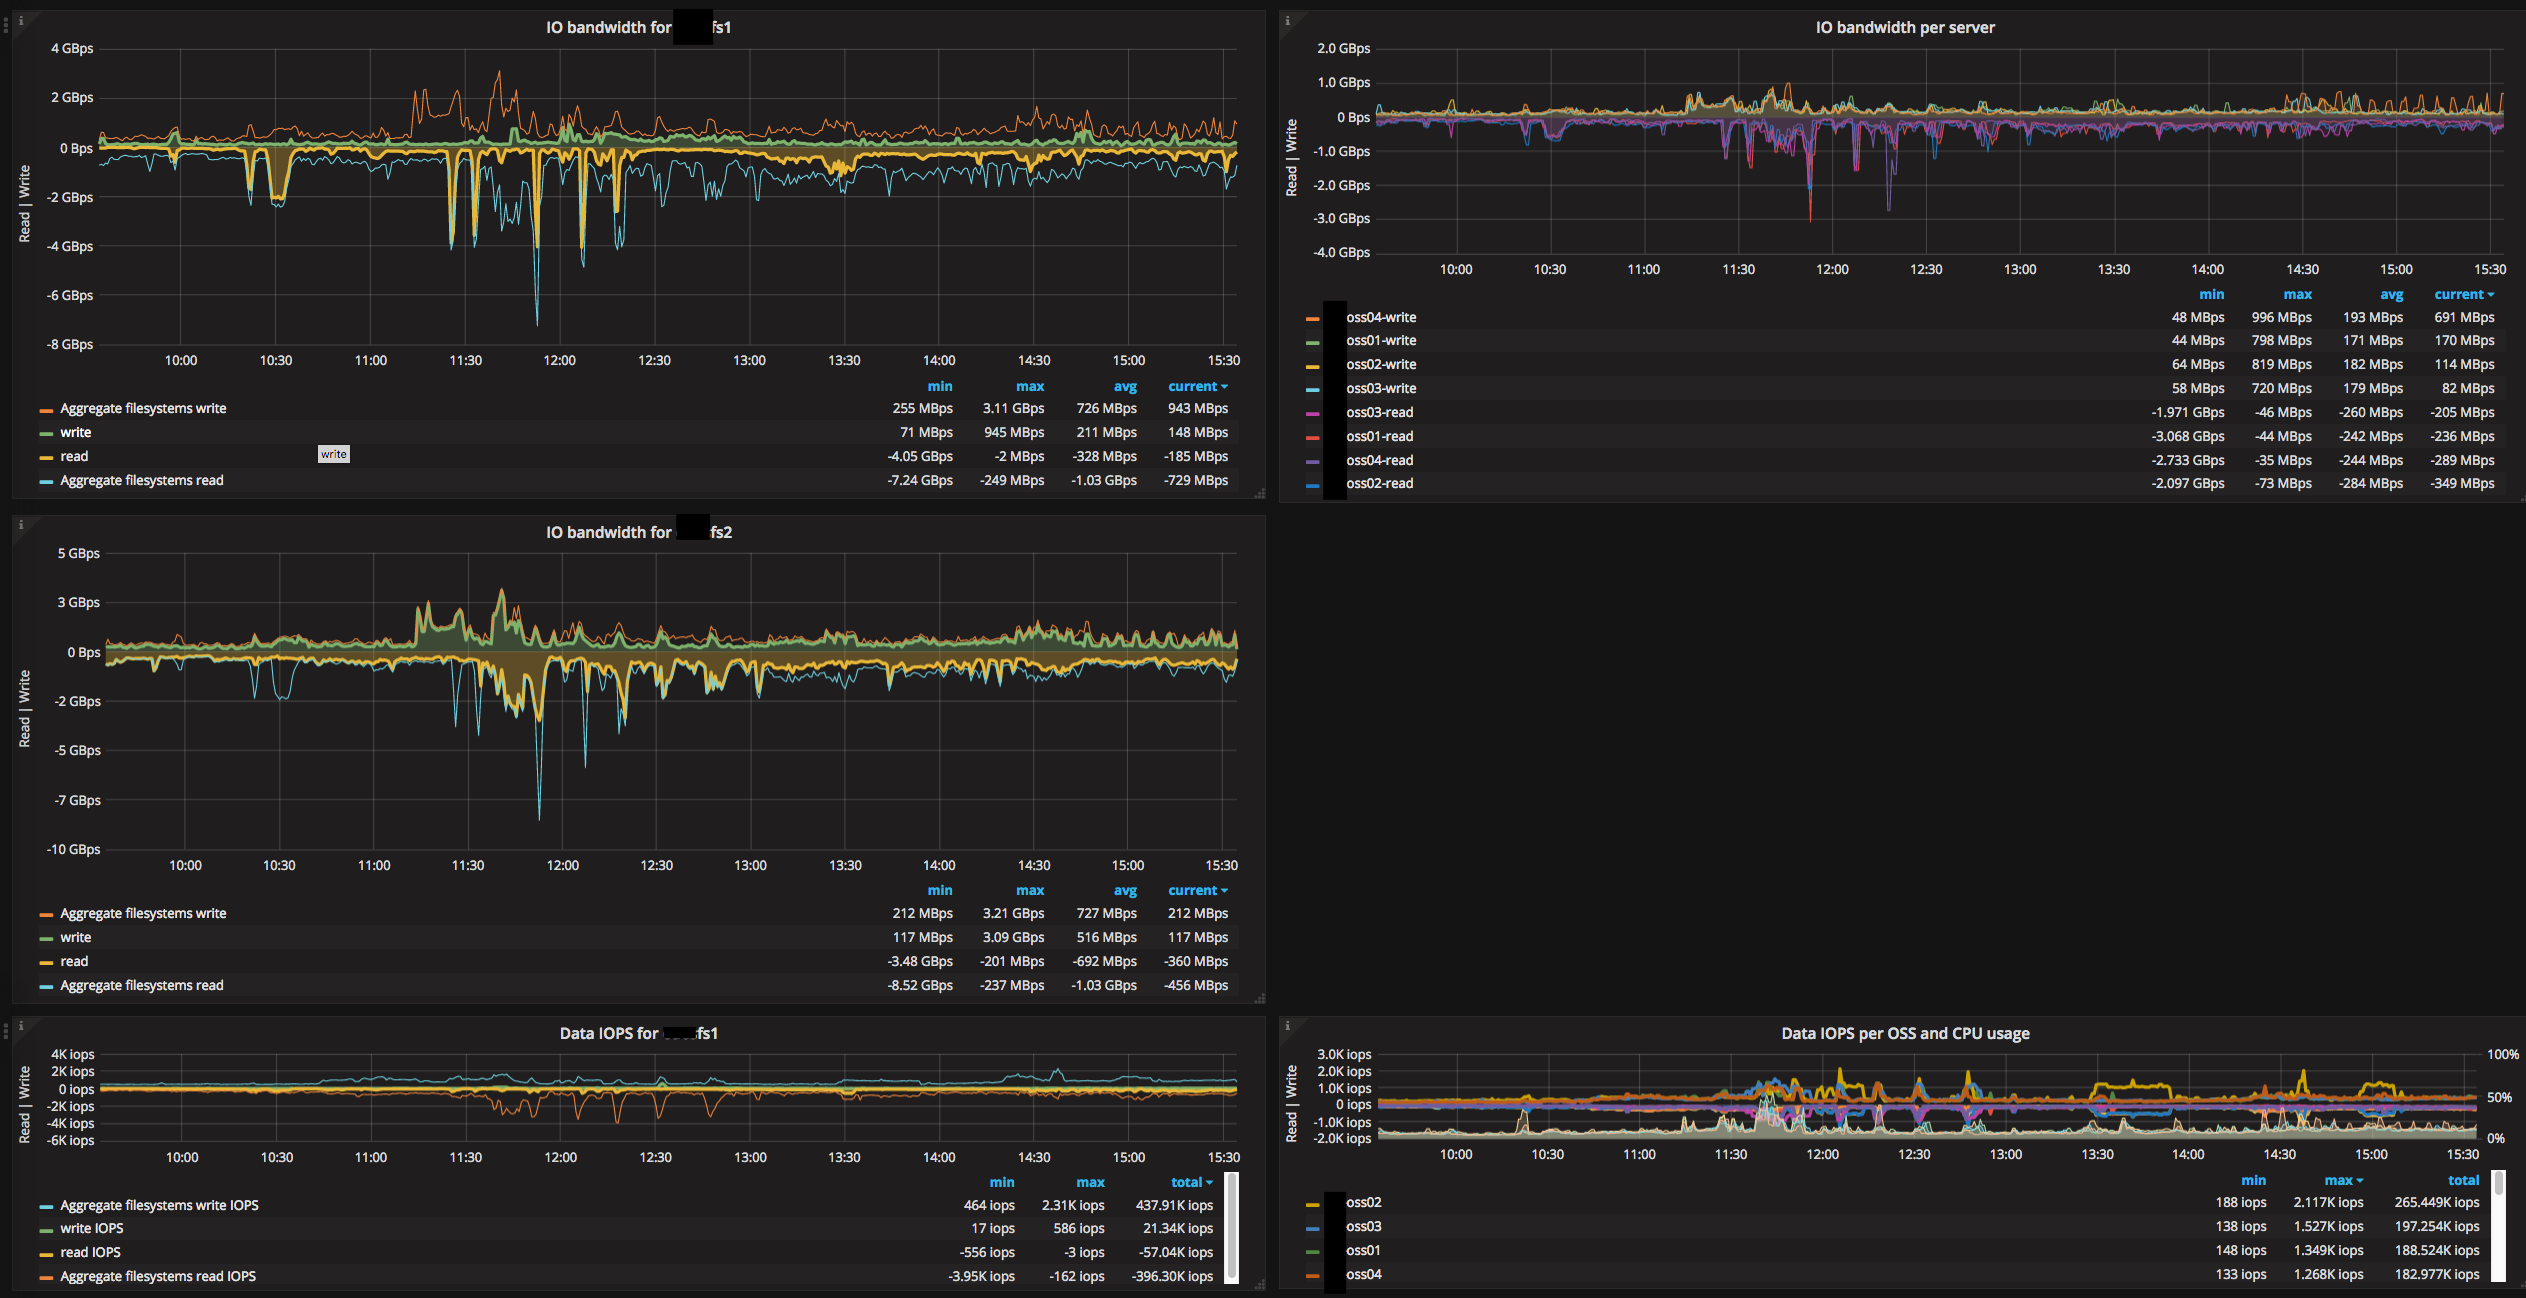
Lustre overview panel supporting more than 1 Lustre filesystem. The main purpose of this panel is a general overview of Lustre which should be useful for 90% of the admins. We have also uploaded more advanced metrics with additional metrics and detailed jobstats dashboards. The following information is provided:
- Number of jobs submitting any IO in the last x minutes. Being x the time configured on job_cleanup_interval.
- Nodes connected per server as seen by connected NIDs on /exports
- Metadata operations per filesystem
- Metadata operations per MDS & CPU usage
- IO bandwidth per filesystem
- IO bandwidth per server
- Data IOPS per filesystem
- Data IOPS per OSS & CPU usage
- Available capacity per target
- Available inodes per target
- Top10 jobstats metadata rate
- Top10 hourly aggregated metadata
- Top10 jobstats data rate
- Top10 hourly aggregated data
Notes:
- Depending on the number of job IDs and the processing capacity of prometheus the jobstats panels might time out. If this is the case try to reduce the granularity or use any other pre-processing aggregation for jobstats.
Data source config
Collector config:
Upload an updated version of an exported dashboard.json file from Grafana
| Revision | Description | Created | |
|---|---|---|---|
| Download |


