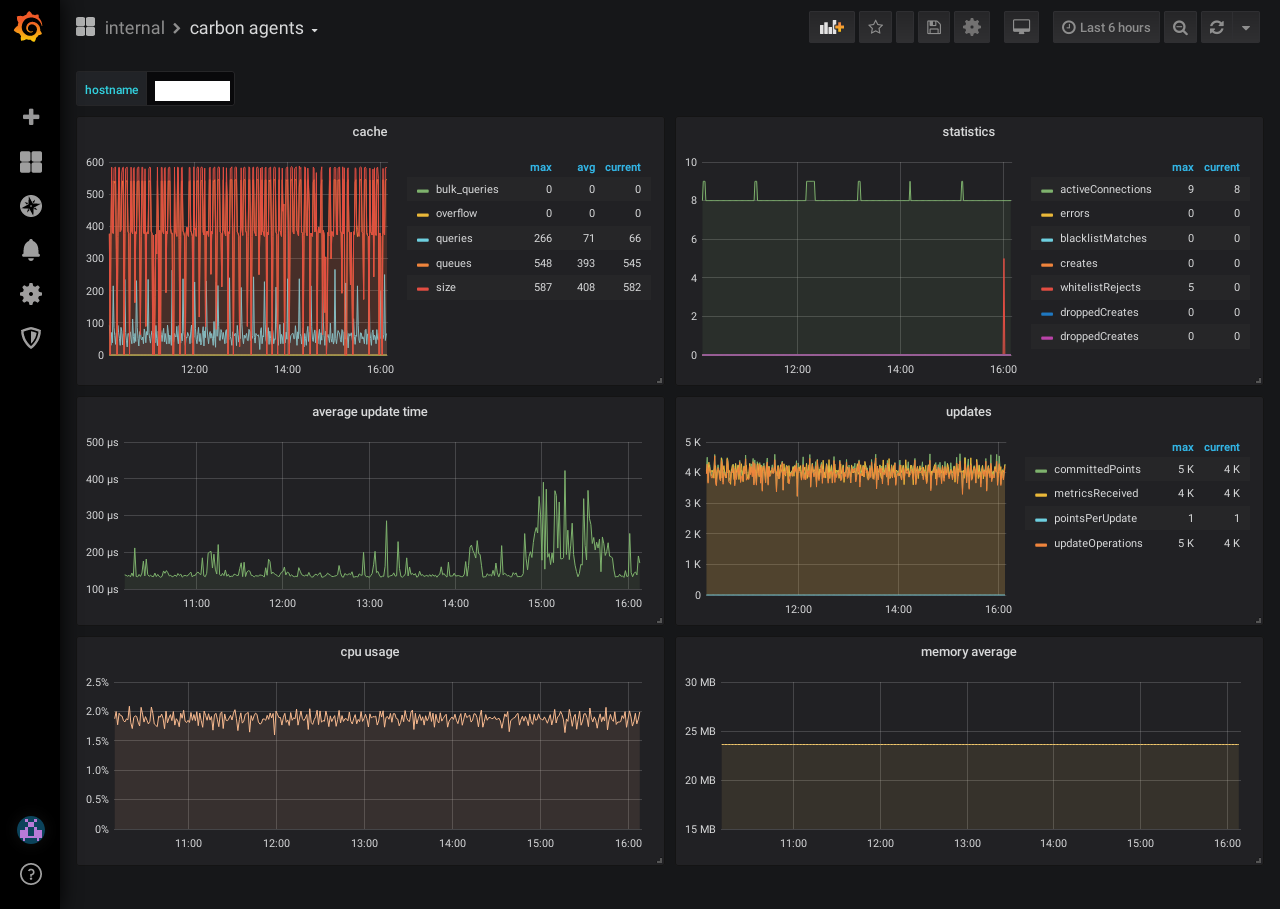
graphite-carbon agents stats
show insternal stats agents graphite carbon
To view internal statistic of graphite-carbon - six graphs:
- cache
- statistic (events)
- avg update time
- updates
- cpu usage
- memory usage
In carbon.conf, by default, carbon itself will log statistics (such as a count, metricsReceived) with the top level prefix of 'carbon' at an interval of 60 seconds. Set CARBON_METRIC_INTERVAL to 0 to disable instrumentation
- CARBON_METRIC_PREFIX = carbon
- CARBON_METRIC_INTERVAL = 60
Data source config
Collector config:
Upload an updated version of an exported dashboard.json file from Grafana
| Revision | Description | Created | |
|---|---|---|---|
| Download |

