a Jenkins performance and health overview for jenkinsci/prometheus-plugin
Jobs queue speeds and rates, Executors availability, Nodes status, Jenkins and JVM resource usage.
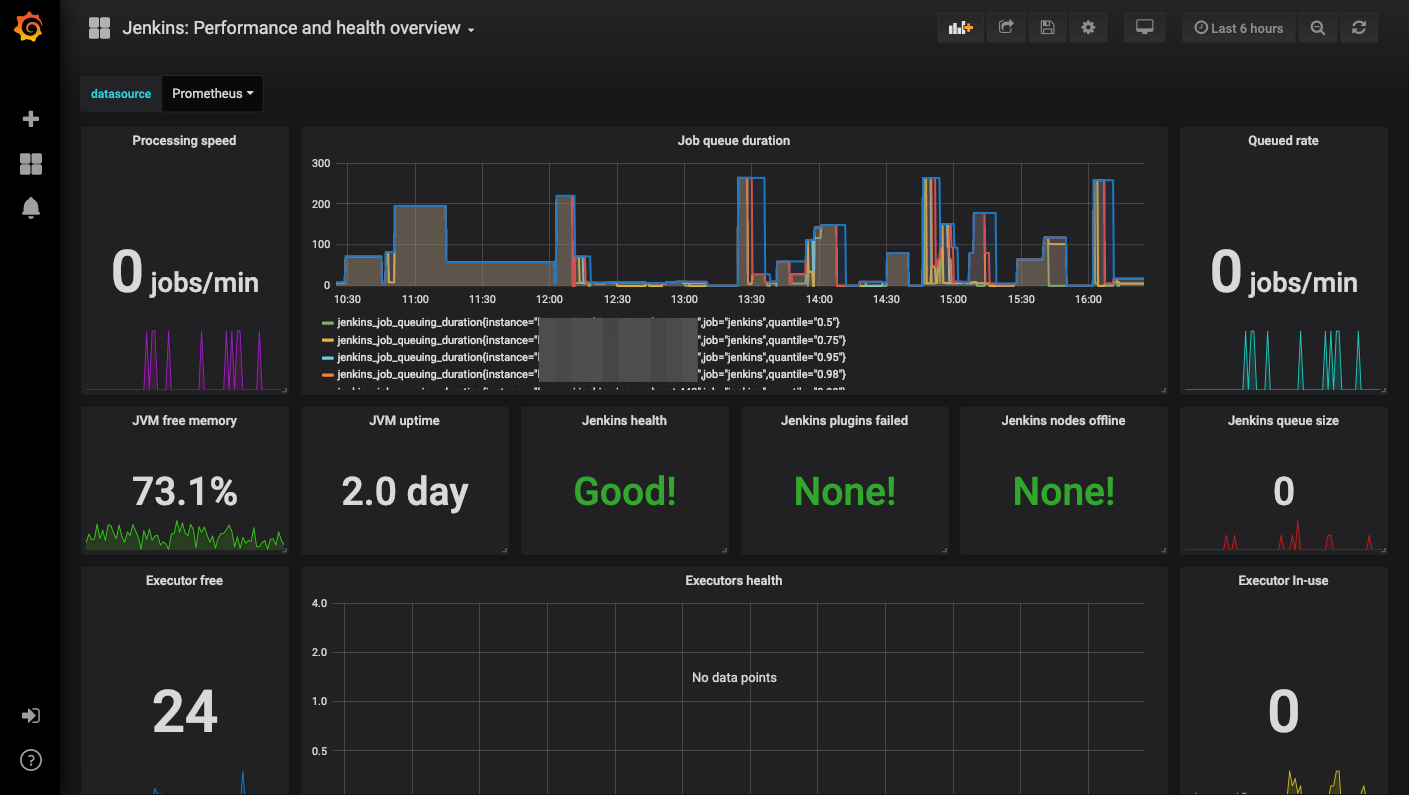
Visualize actual version of metrics from jenkinsci/prometheus-plugin. Scrape configuration:
- job_name: 'jenkins'
  metrics_path: '/prometheus/'
  scheme: https
  bearer_token: <bearer_token>
  static_configs:
      - targets: ['jenkins.example.org:443']
Data source config
Collector type:
Collector plugins:
Collector config:
Revisions
Upload an updated version of an exported dashboard.json file from Grafana
| Revision | Description | Created | |
|---|---|---|---|
| Download |
Jenkins
Easily monitor your deployment of Jenkins, the open source automation server, with Grafana Cloud's out-of-the-box monitoring solution.
Learn more