
UCP Dashboard
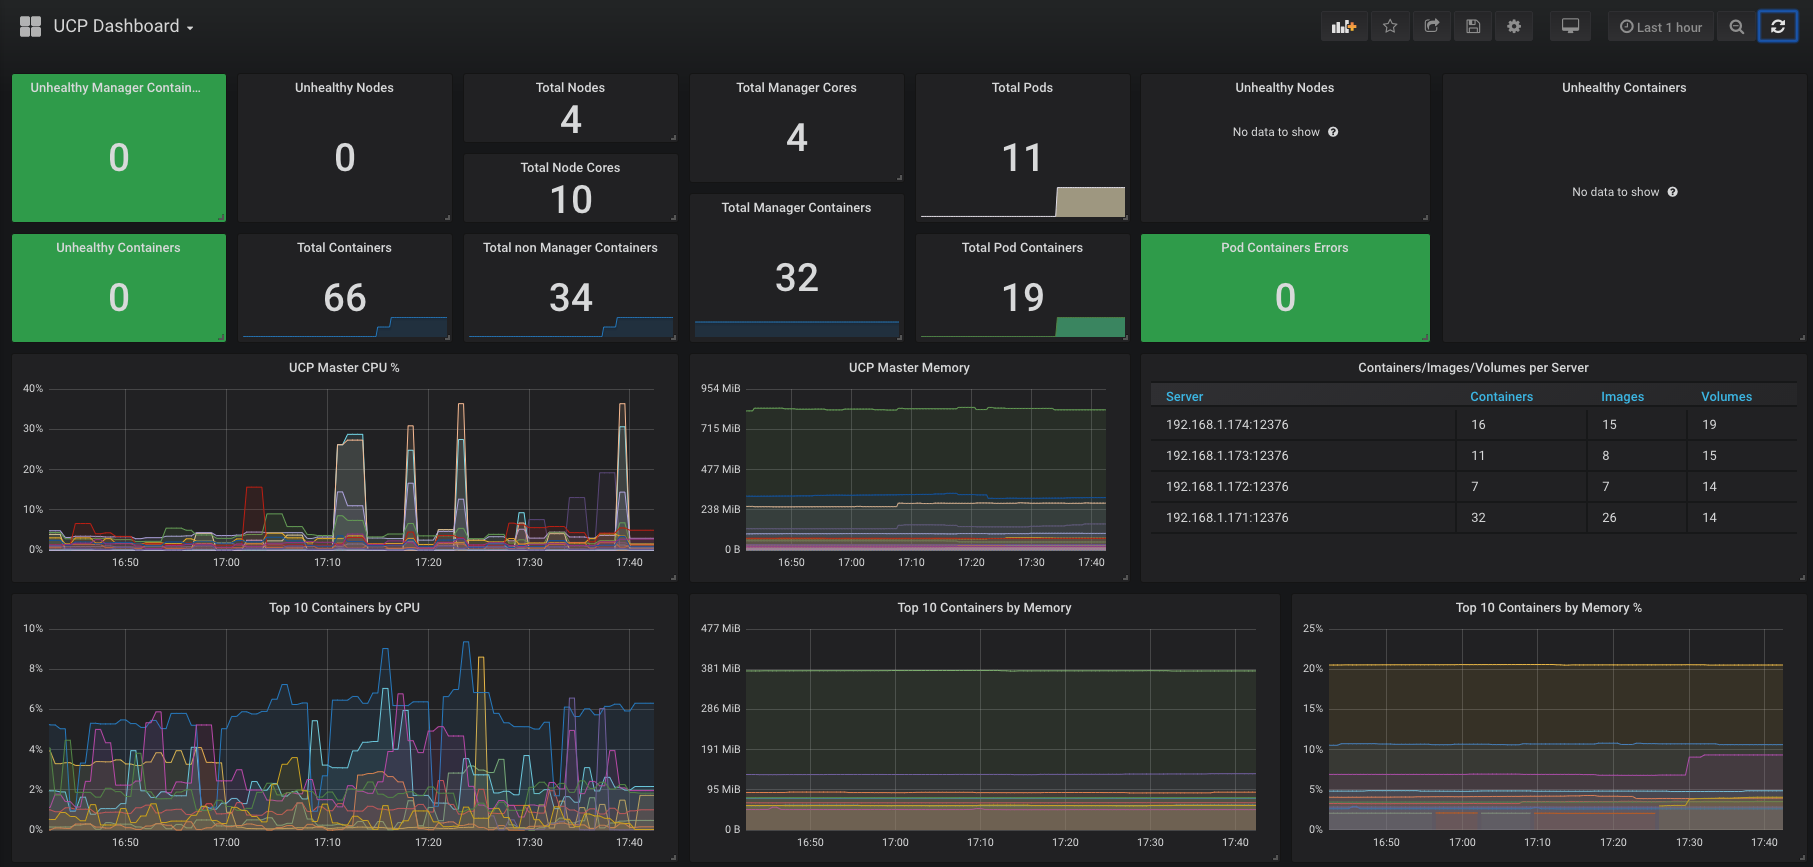
Docker EE 3.1 UCP Metrics
Expose the ucp-metrics prometheus port by adding the below to the ucp-metrics service.
kubectl edit svc -n kube-system ucp-metrics
  - name: prometheus
      port: 9090
      protocol: TCP
      targetPort: 9090
Add the Prometheus datasource to Grafana and import this dashboard.
http://ucp-metrics.kube-system.svc:9090
Data source config
Collector type:
Collector plugins:
Collector config:
Revisions
Upload an updated version of an exported dashboard.json file from Grafana
| Revision | Description | Created | |
|---|---|---|---|
| Download |