
1 Node Exporter 1.0.1
Host Metrics (VM, Server, OS) https://github.com/fchiorascu/Observability
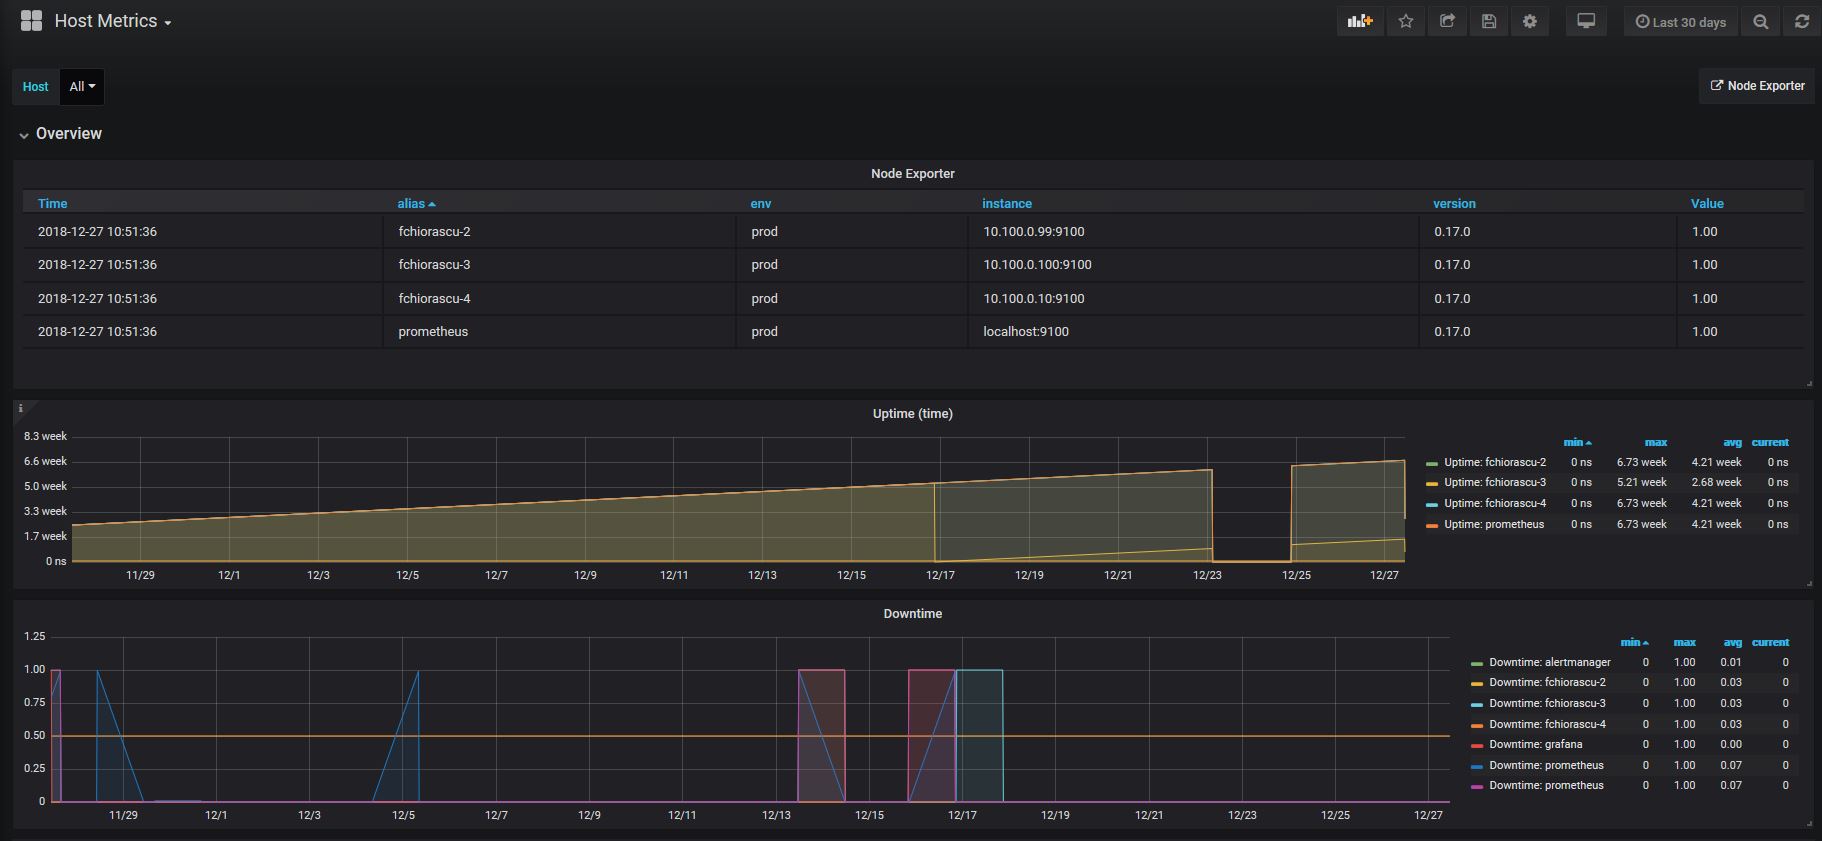
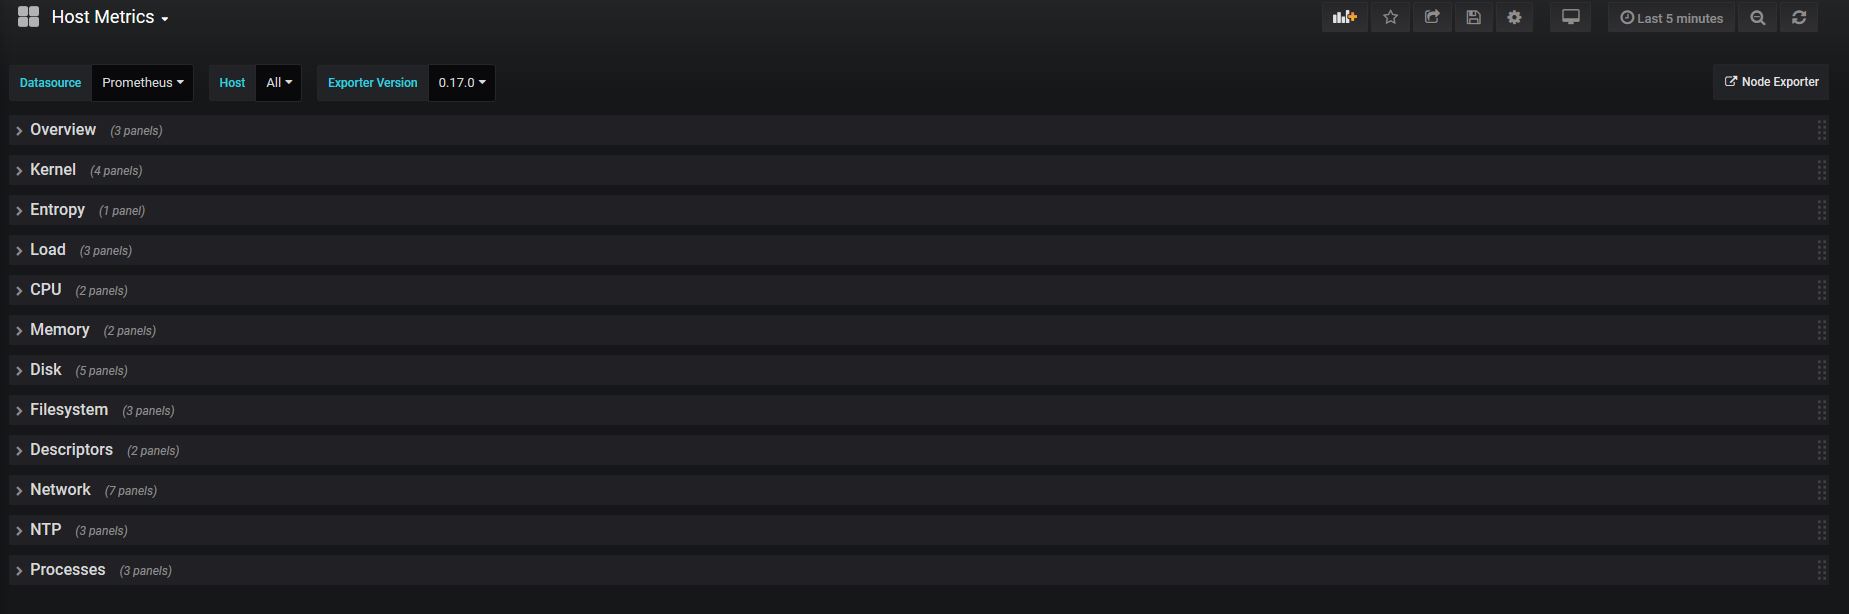
This dashboard is Dynamic where you can have the metrics for: 1 VM, Multiple VMs or All VMs.
Metrics:
- UP
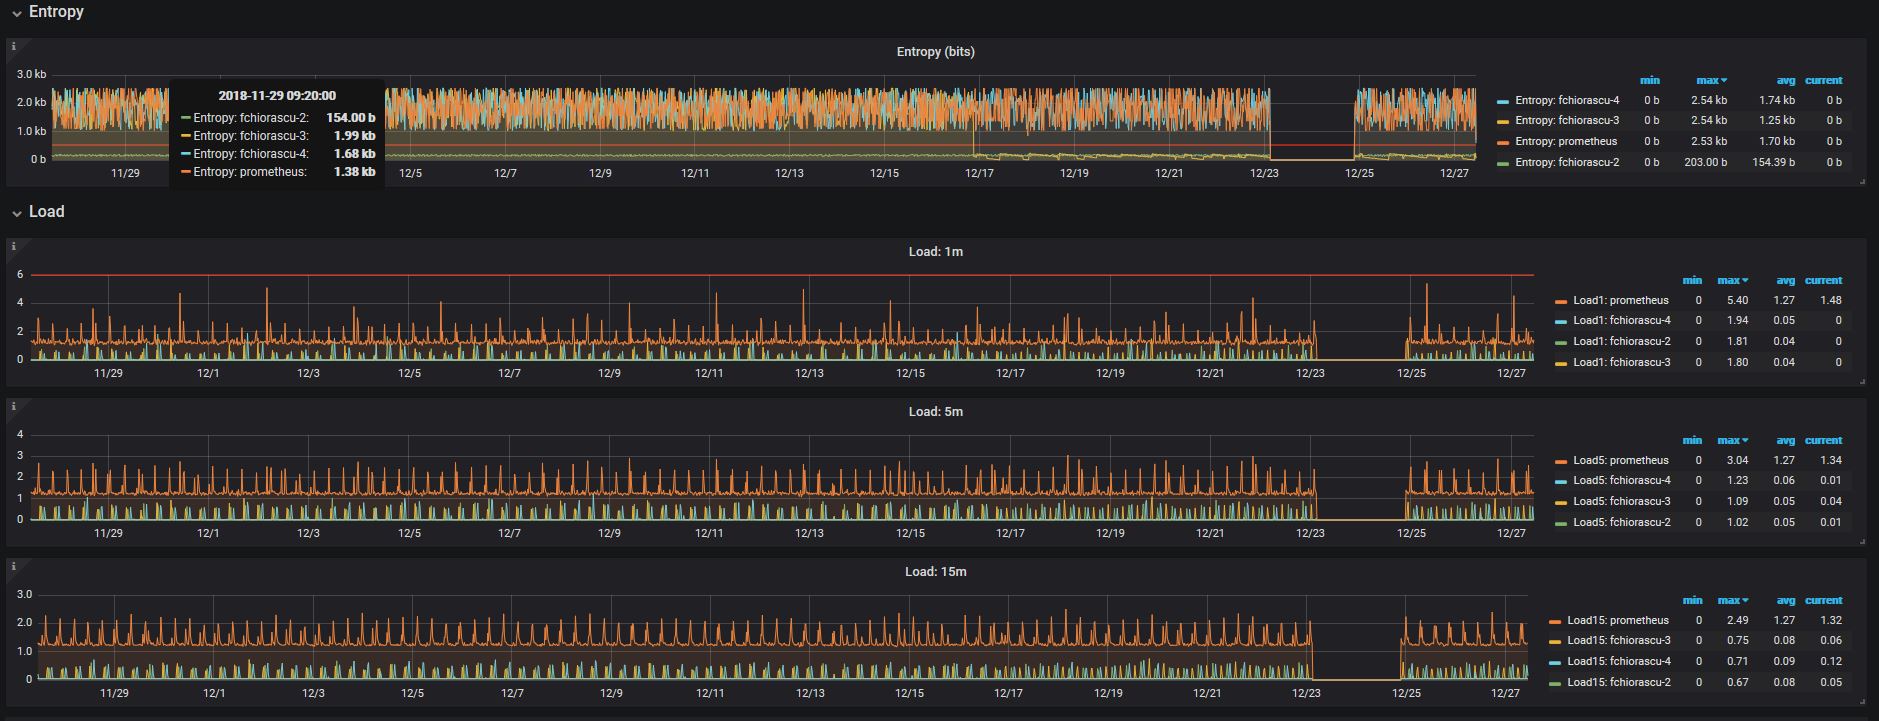
- Load
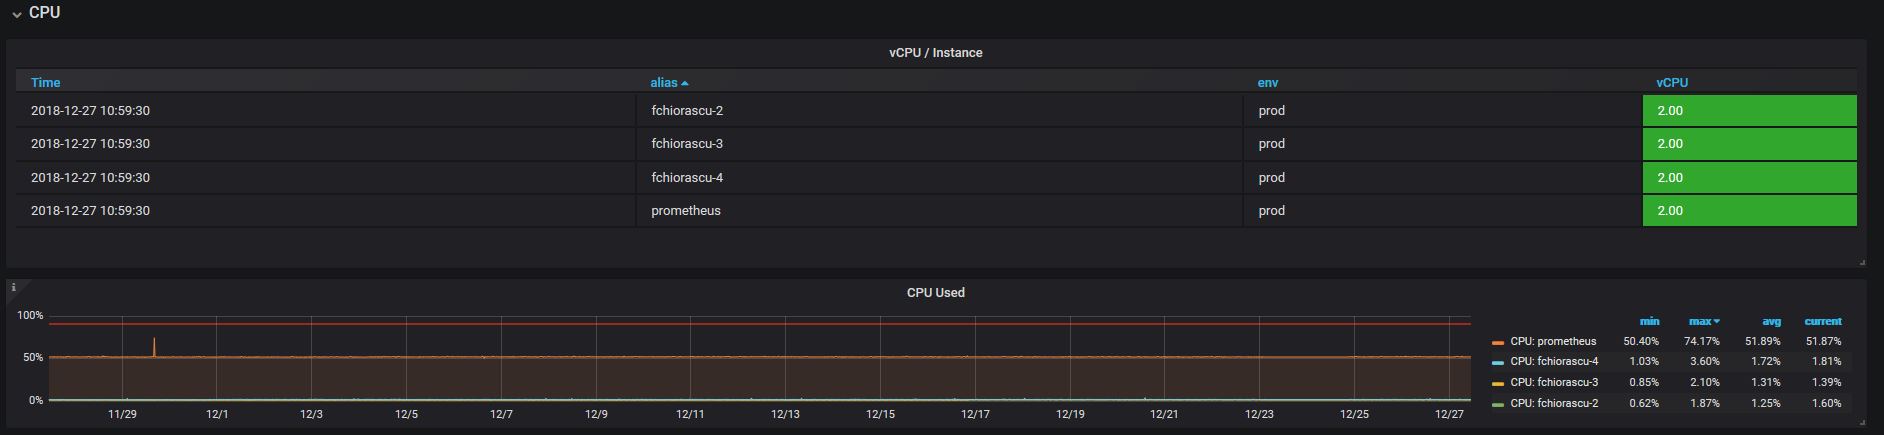
- CPU
- RAM
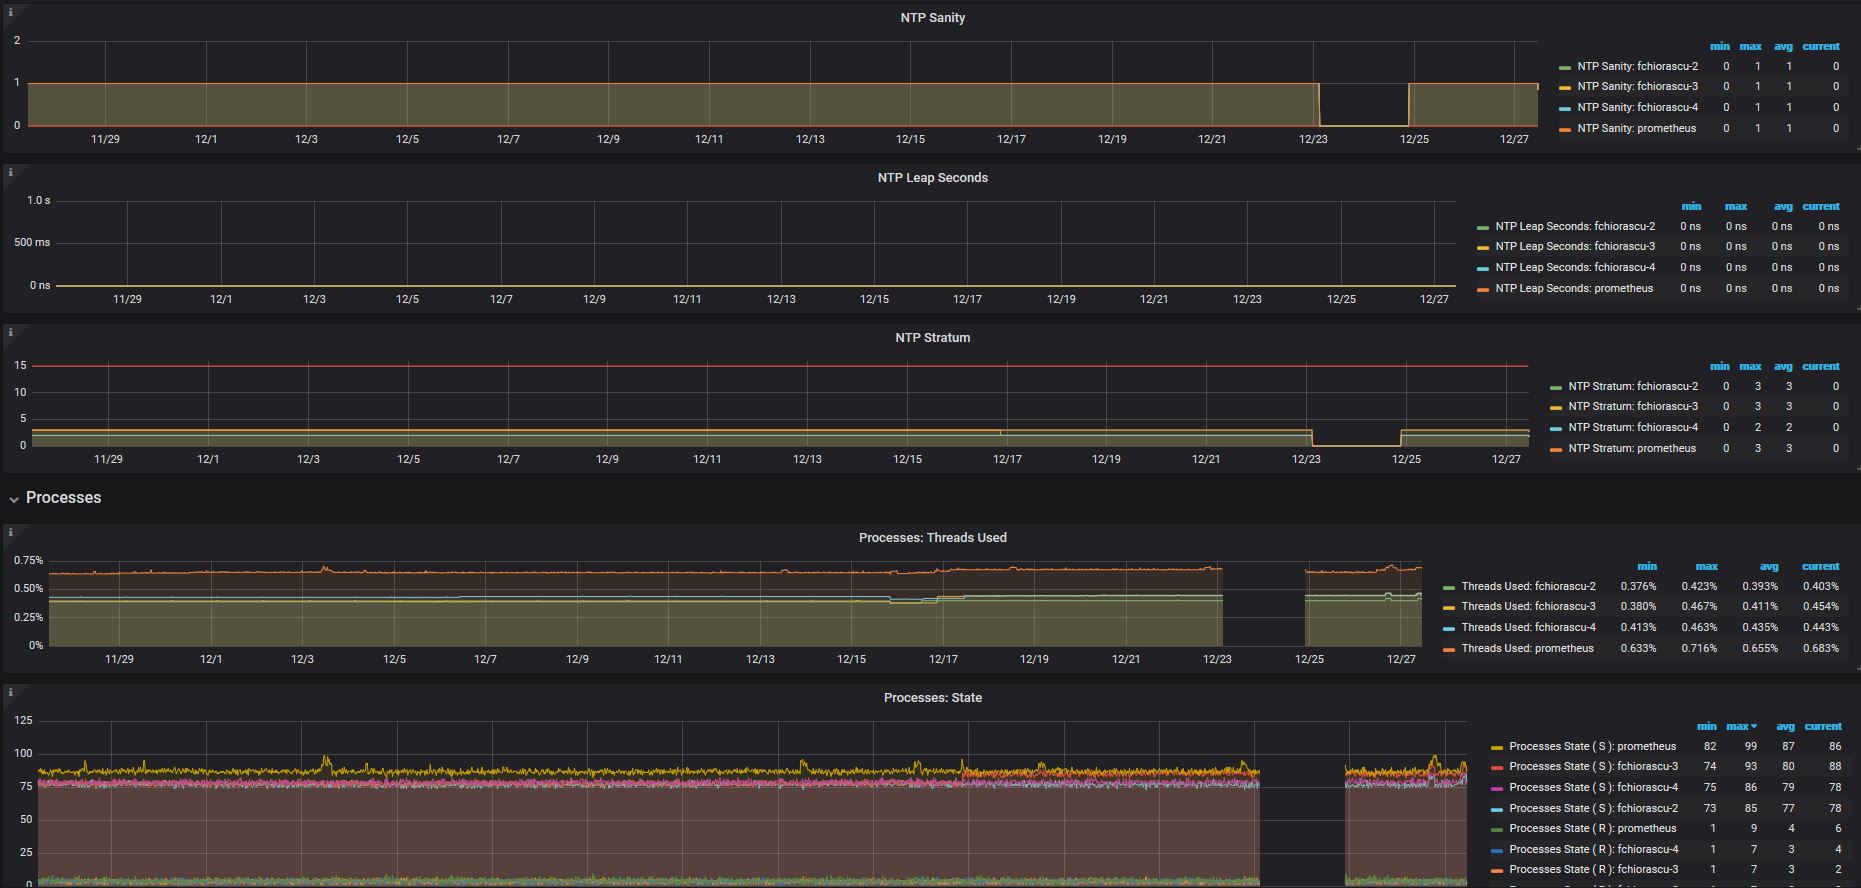
- NTP
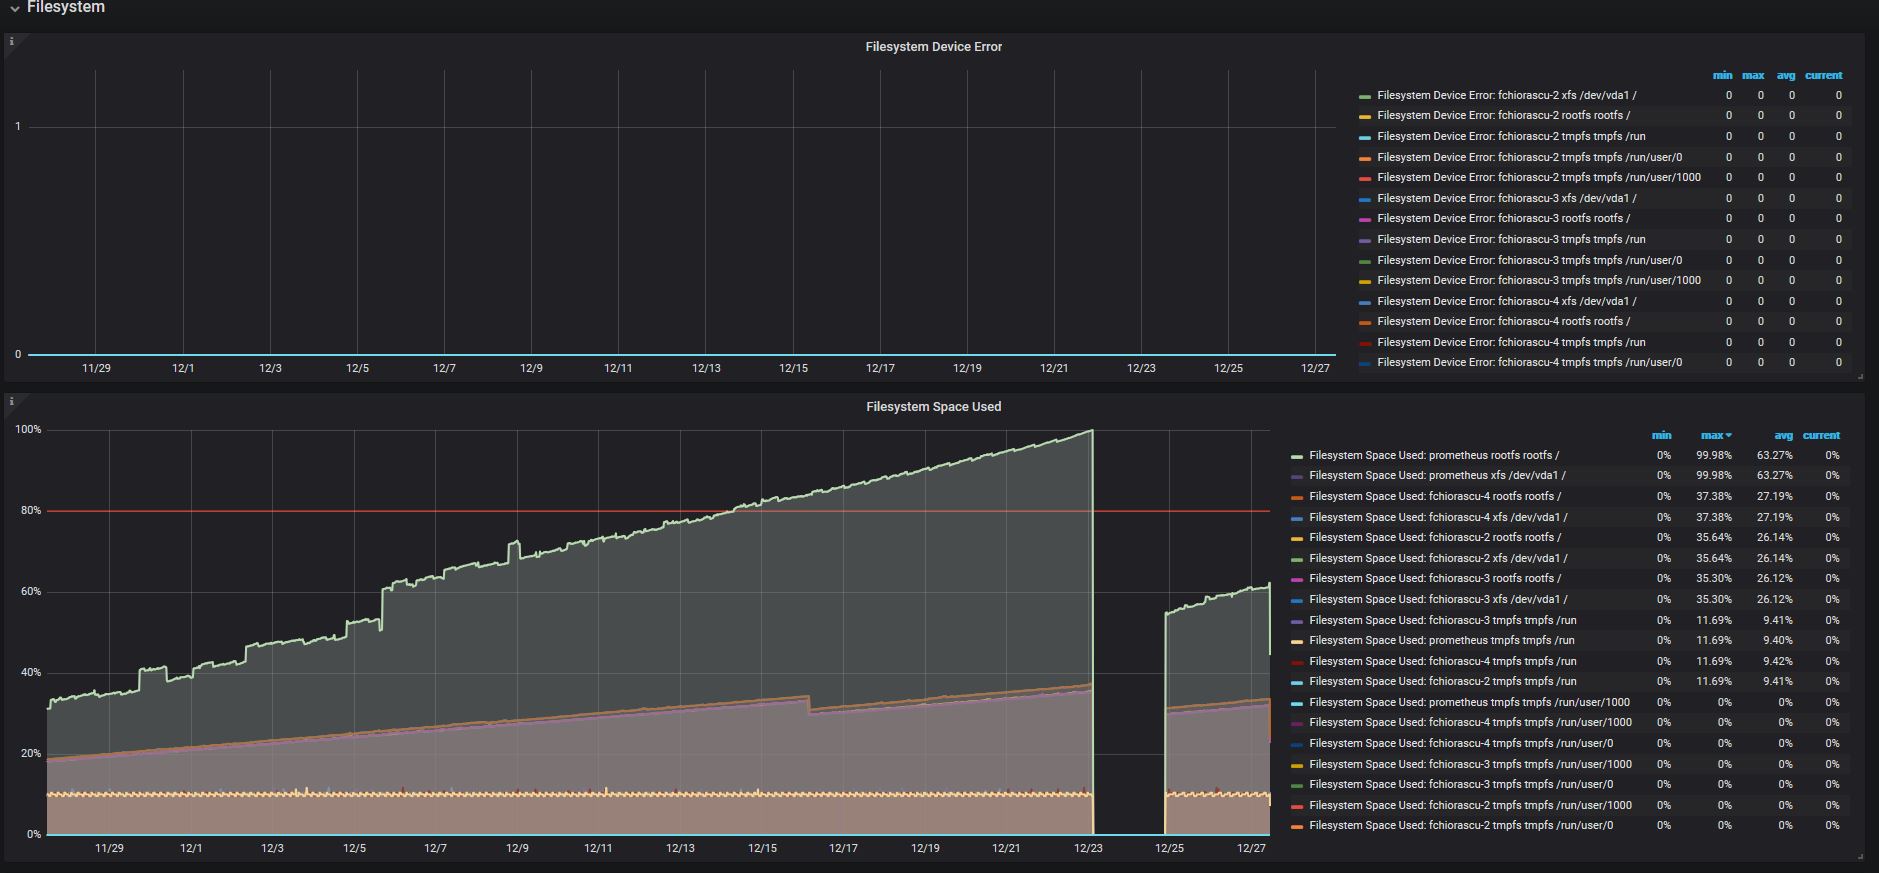
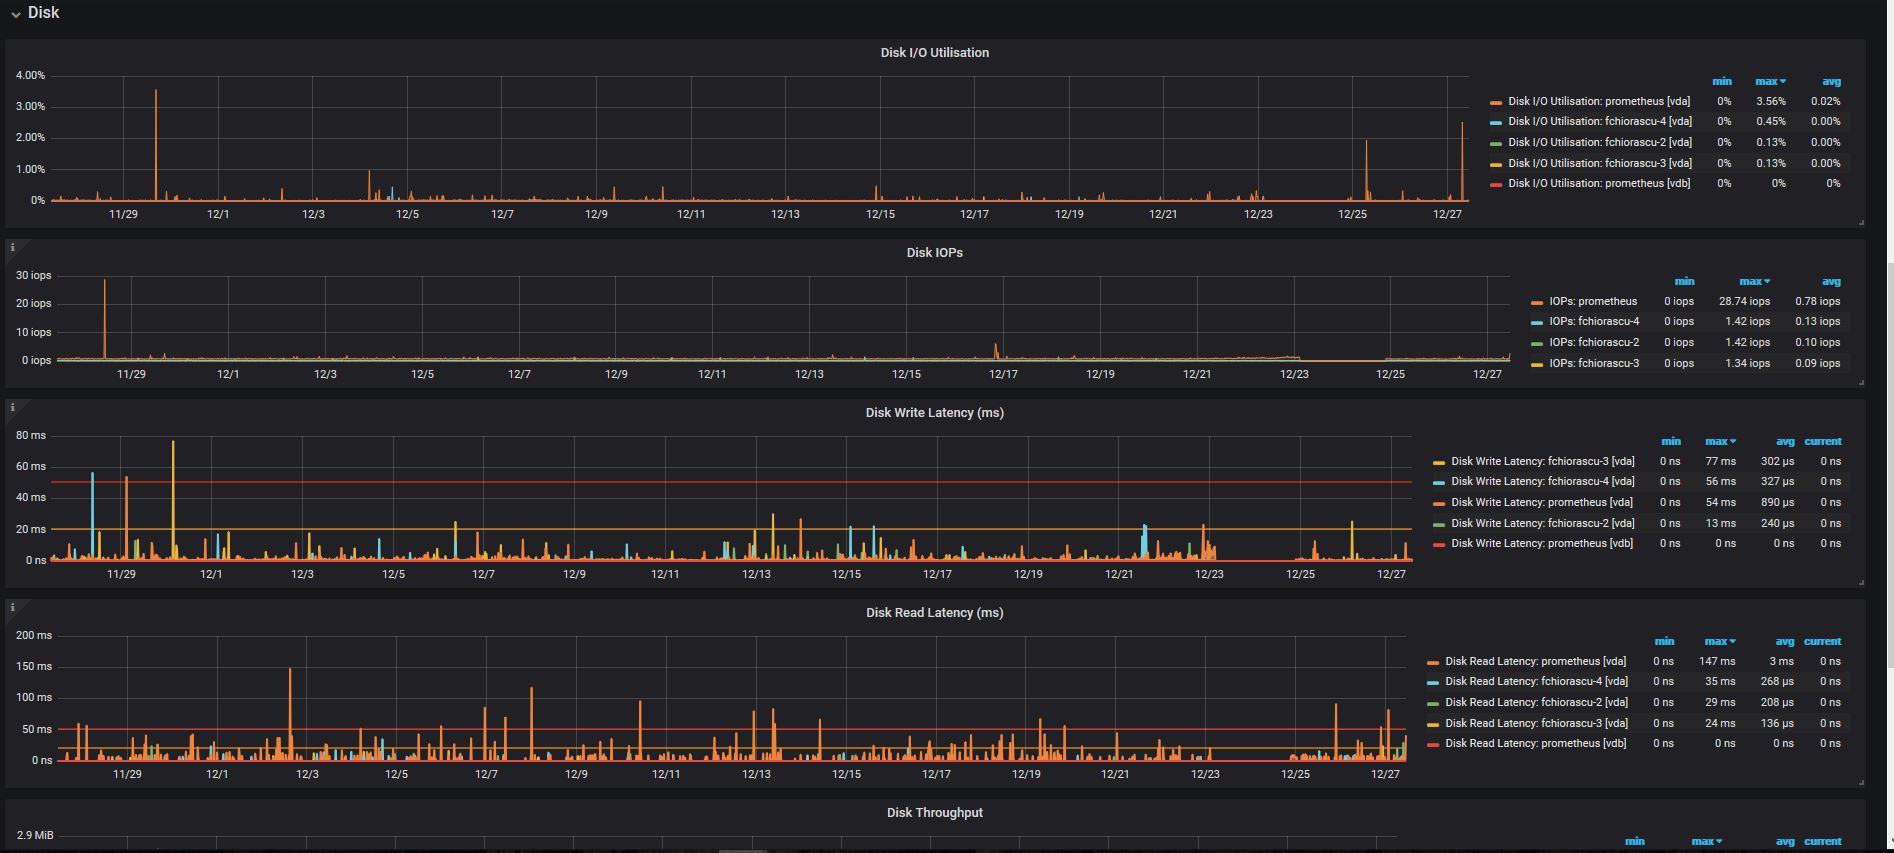
- Disk
- Swap
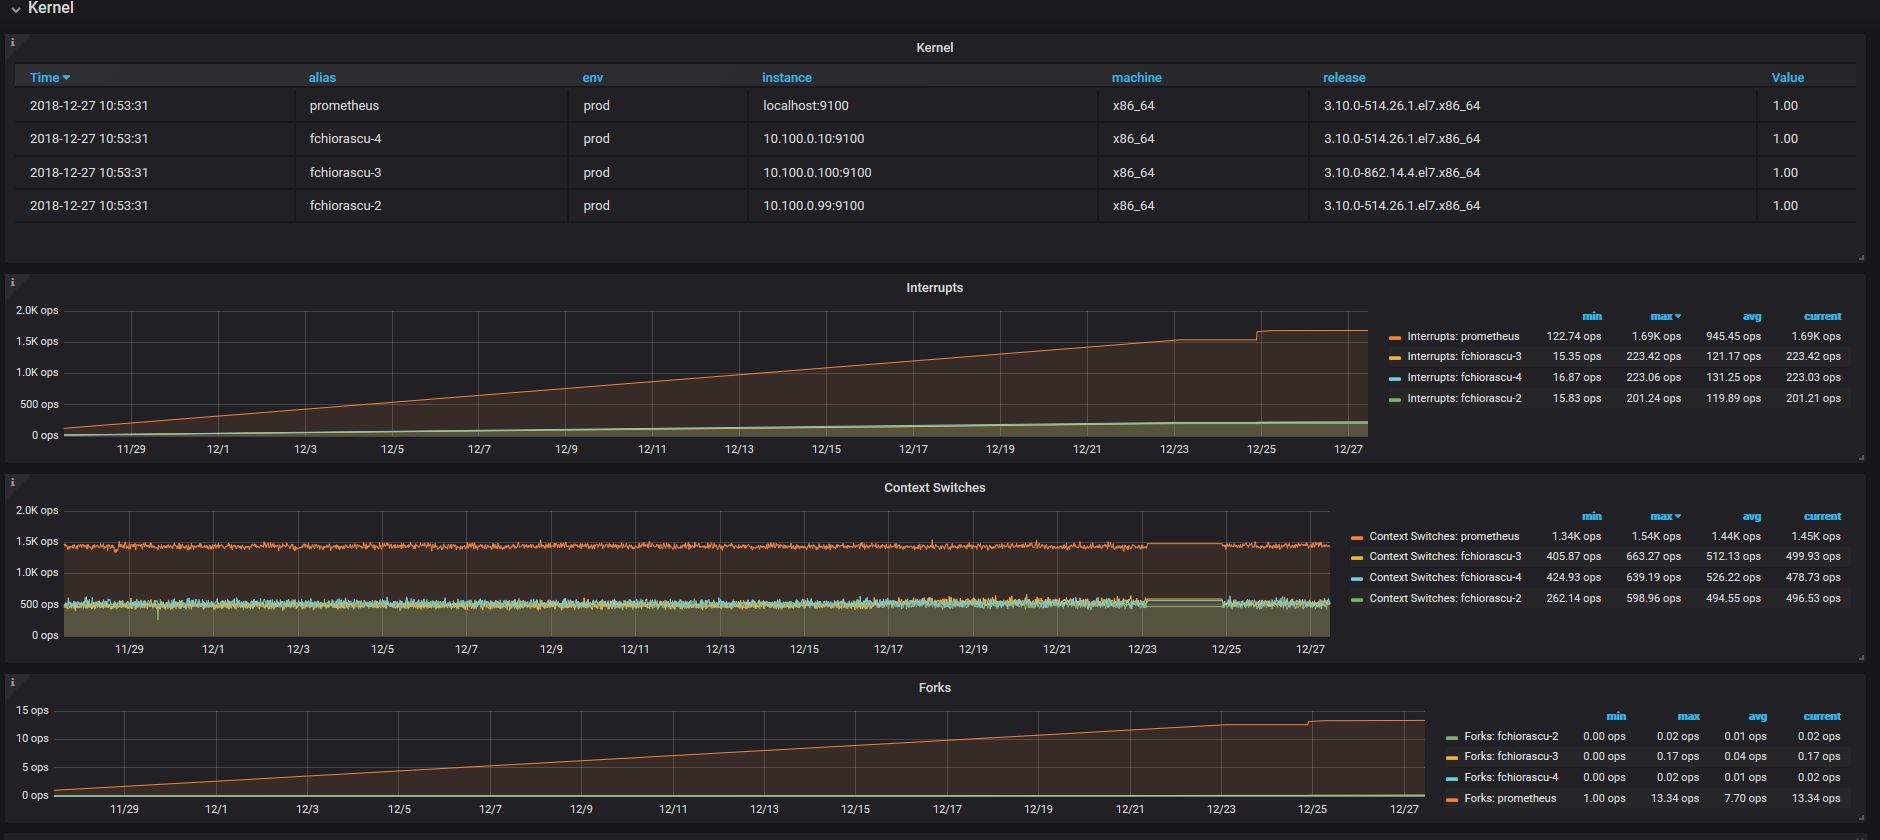
- Forks
- Inodes
- Kernel
- Uptime
- Entropy
- Threads
- Network
- Systemd
- Interrupts
- Processes
- File Descriptors
- Switches Context
Versions:
- Grafana: 7.4.0+
- Prometheus: 2.24.1+
- Node Exporter: 1.0.1+
Interval and range variables: http://docs.grafana.org/features/datasources/prometheus/
- Support for $__range, $__range_s and $__range_ms only available from Grafana v5.3
- It’s possible to use some global built-in variables in query variables; $__interval, $__interval_ms, $__range, $__range_s and $__range_ms, see Global built-in variables for more information. These can be convenient to use in conjunction with the query_result function when you need to filter variable queries since label_values function doesn’t support queries.
- Make sure to set the variable’s refresh trigger to be On Time Range Change to get the correct instances when changing the time range on the dashboard.
Data source config
Collector type:
Collector plugins:
Collector config:
Dashboard revisions
Upload an updated version of an exported dashboard.json file from Grafana
| Revision | Decscription | Created | |
|---|---|---|---|
| Download |
Sign up for Grafana Cloud

Get up and running in minutes with the Grafana Cloud free tier, which includes free forever 10k metrics, 50GB logs, 50GB traces, 500 VUh, and more.
Get this dashboard
Data source:
Dependencies: