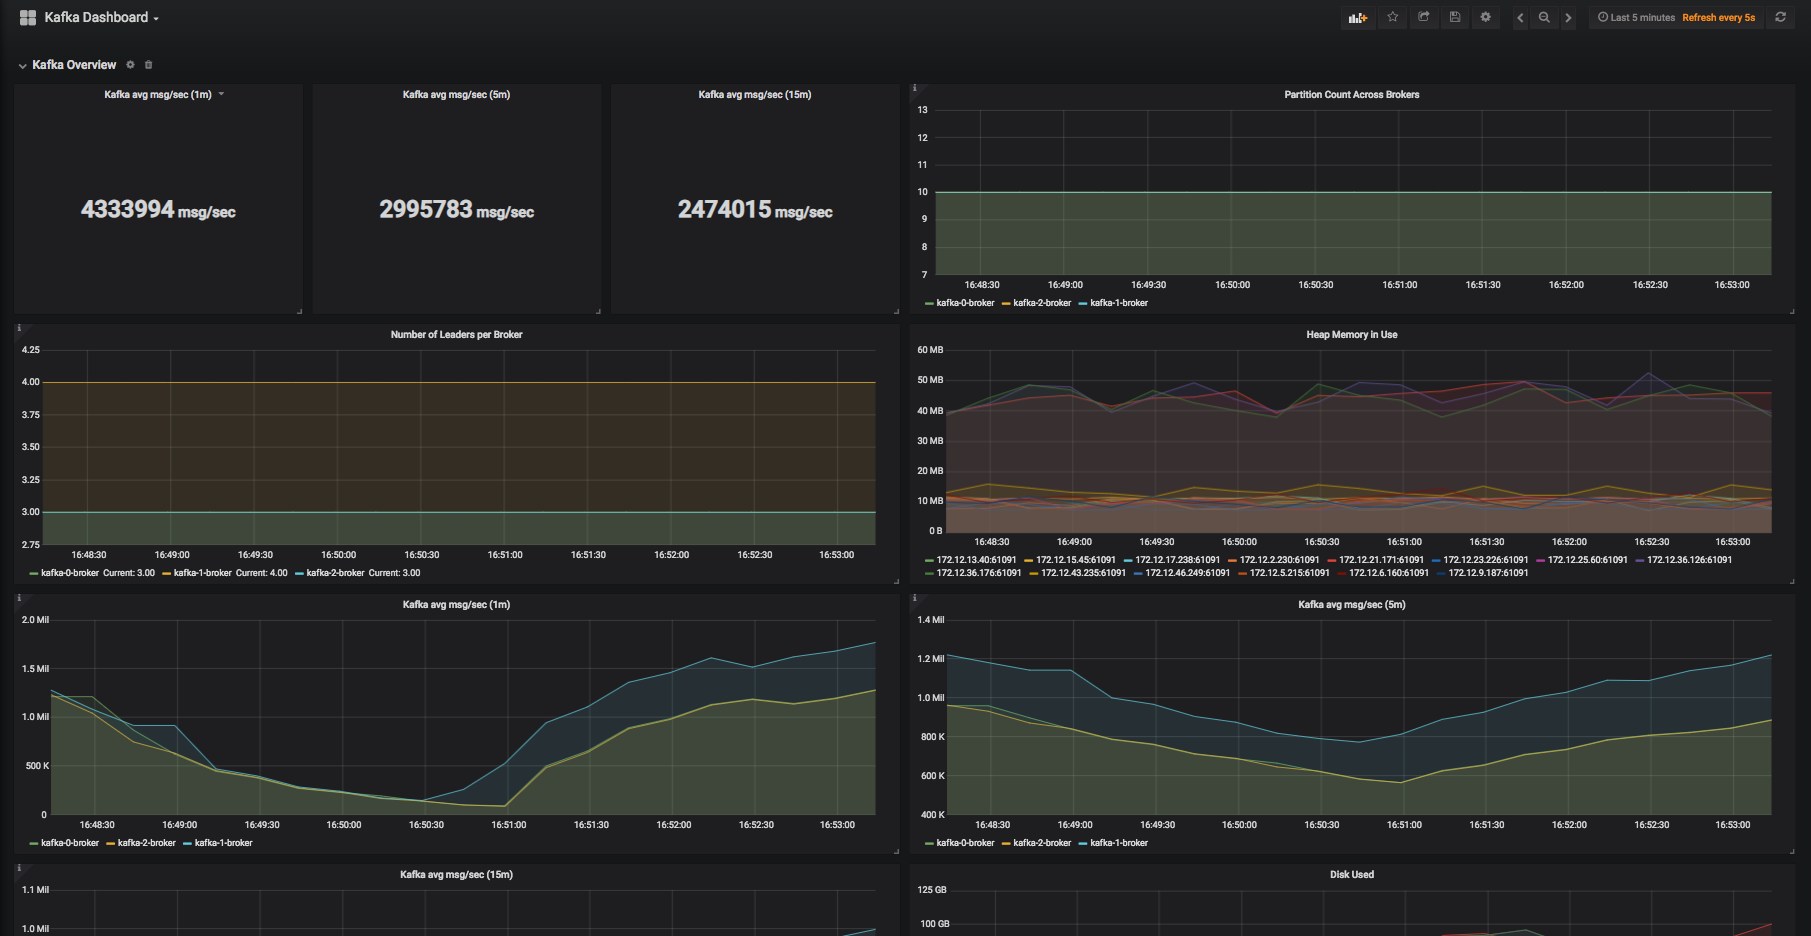
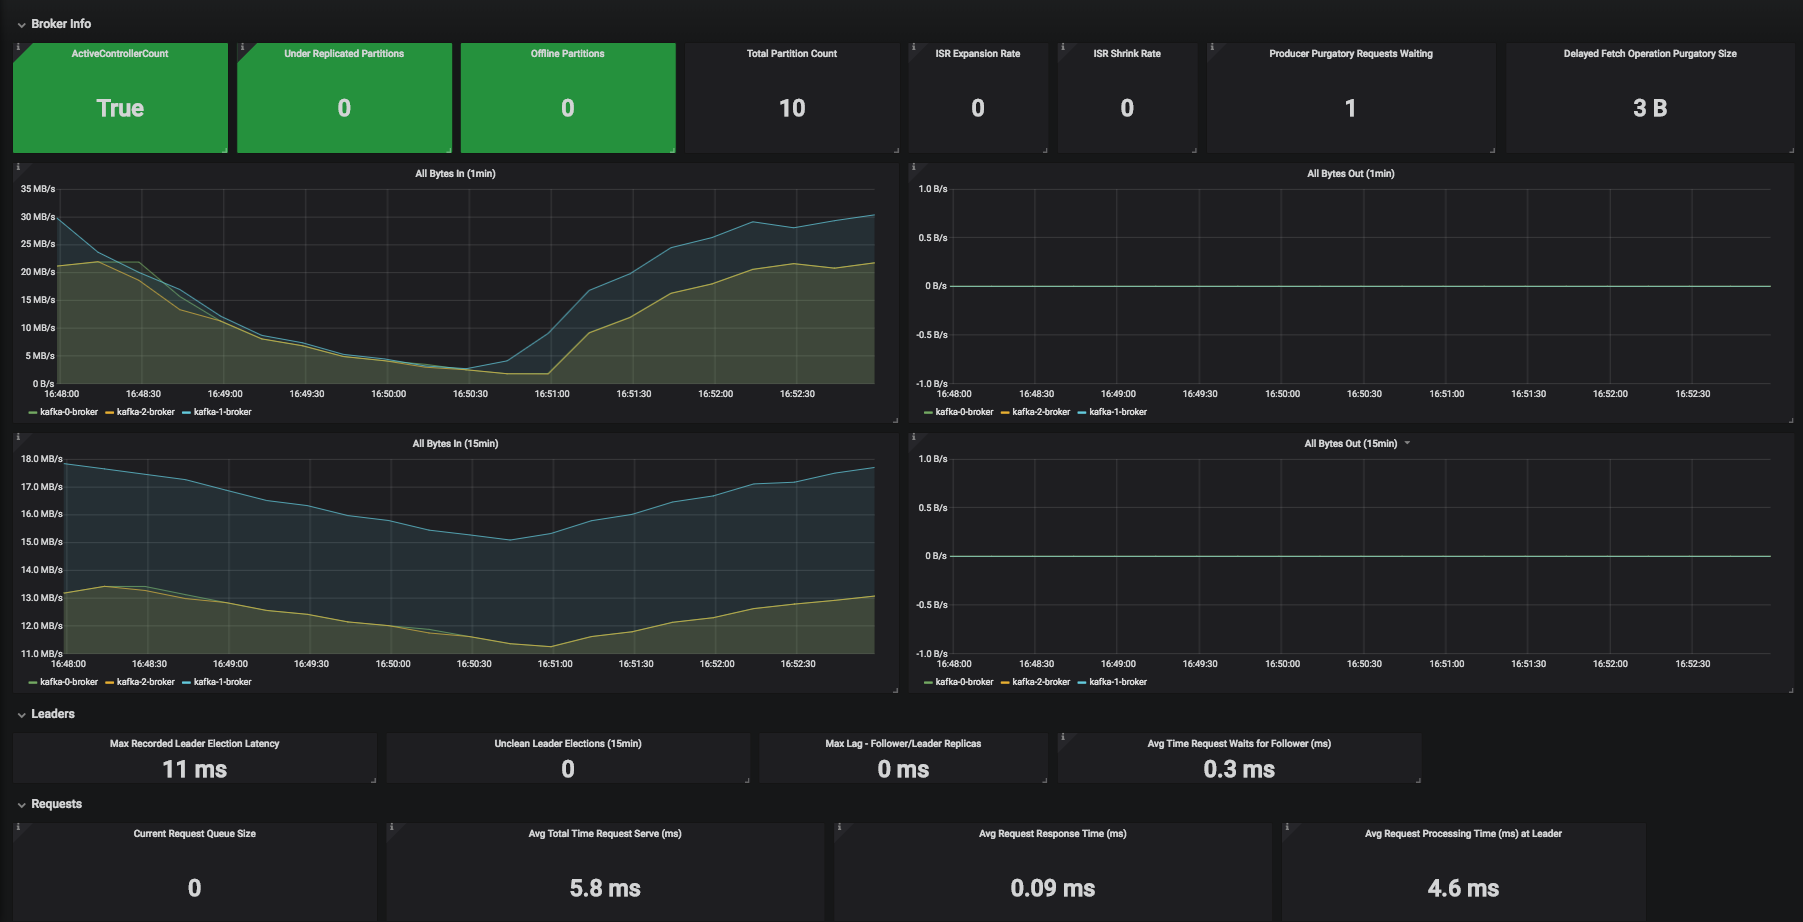
1.12 DC/OS Global Kafka Dashboard
Example of a Global Kafka Dashboard for DC/OS 1.12 - For Operators: Global view metrics of all Kafka Clusters, Brokers, and Topics
Instructions on how to get 1.12 DC/OS Prometheus/Grafana up and running with some sample dashboards at the link below:
Instructions on how to Performance Test and Monitor Kafka on DC/OS 1.12 here:
Data source config
Collector type:
Collector plugins:
Collector config:
Revisions
Upload an updated version of an exported dashboard.json file from Grafana
| Revision | Description | Created | |
|---|---|---|---|
| Download |
Kafka
Easily monitor your Kafka deployment with Grafana Cloud's out-of-the-box monitoring solution.
Learn more