
Kamon System JVM metrics
Node jvm metrics
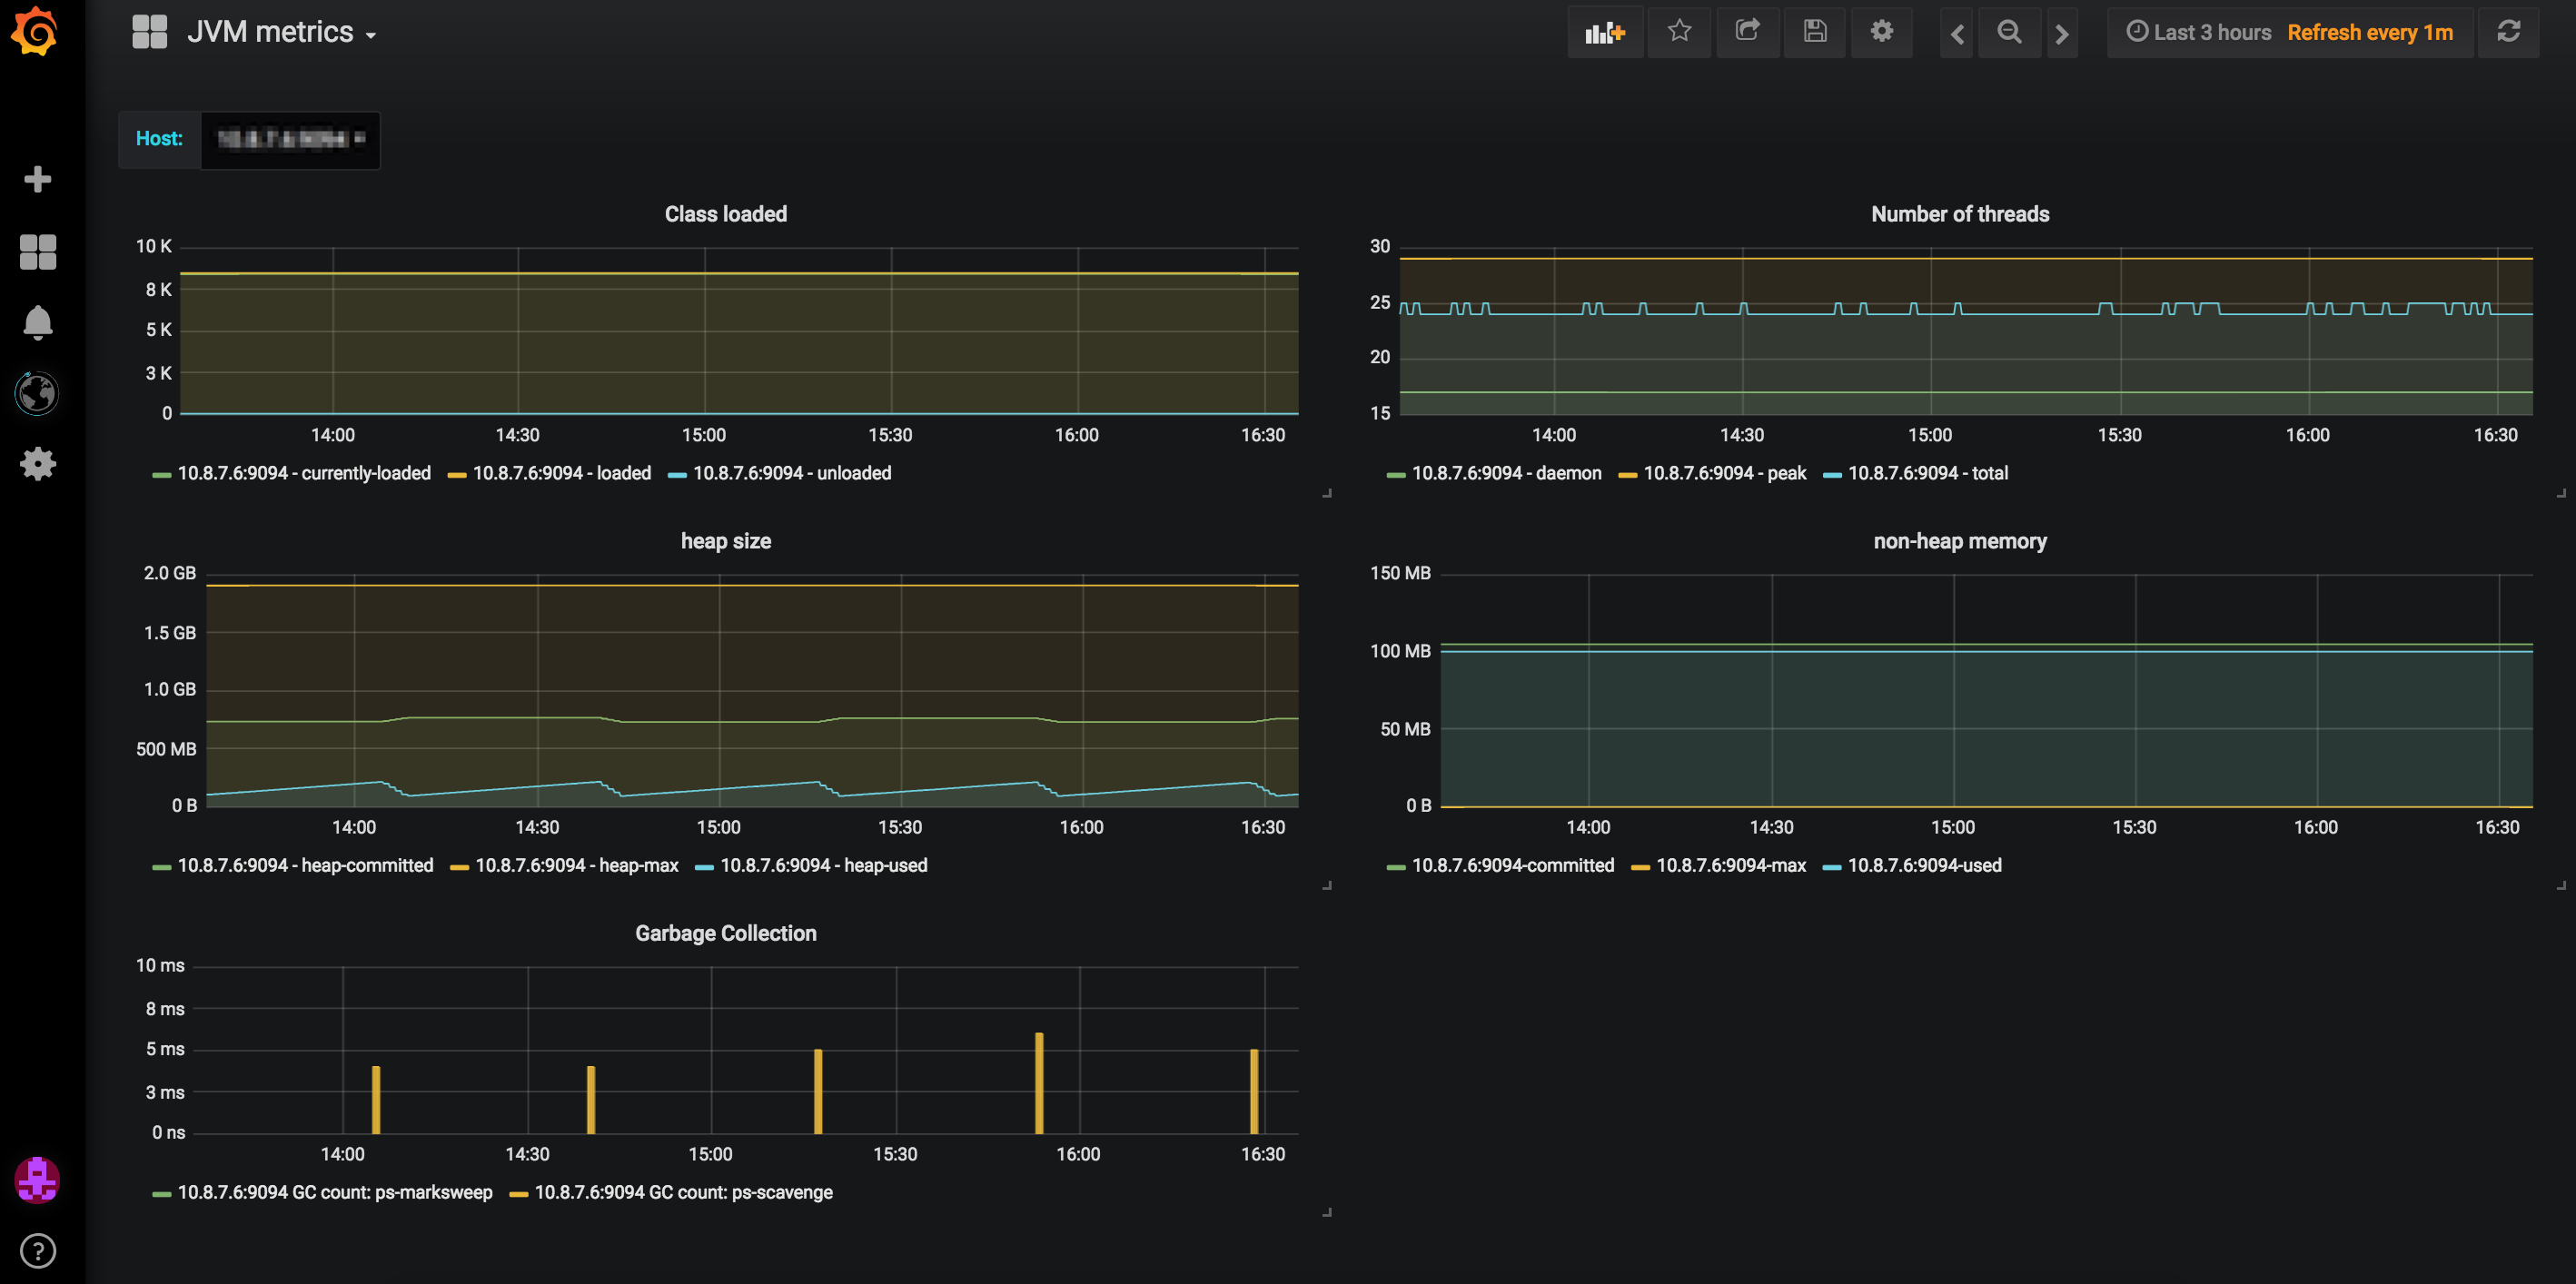
Dashboard of JVM typical metrics when using Kamon (1.x.x) System Metrics version used 1.0.0.
Displays typical JVM metrics:
Number of loaded classes Number of threads Heap usage Non-heap memory GC activity Source can be found in https://github.com/jaksky/kamon-grafana-dashboards
Data source config
Collector type:
Collector plugins:
Collector config:
Dashboard revisions
Upload an updated version of an exported dashboard.json file from Grafana
| Revision | Decscription | Created | |
|---|---|---|---|
| Download |
Sign up for Grafana Cloud

Get up and running in minutes with the Grafana Cloud free tier, which includes free forever 10k metrics, 50GB logs, 50GB traces, 500 VUh, and more.
Get this dashboard
Data source:
Dependencies: