MyPerf4J-InfluxDBv1.x-JVM
Metrics from MyPerf4J stored in InfluxDB v1.x
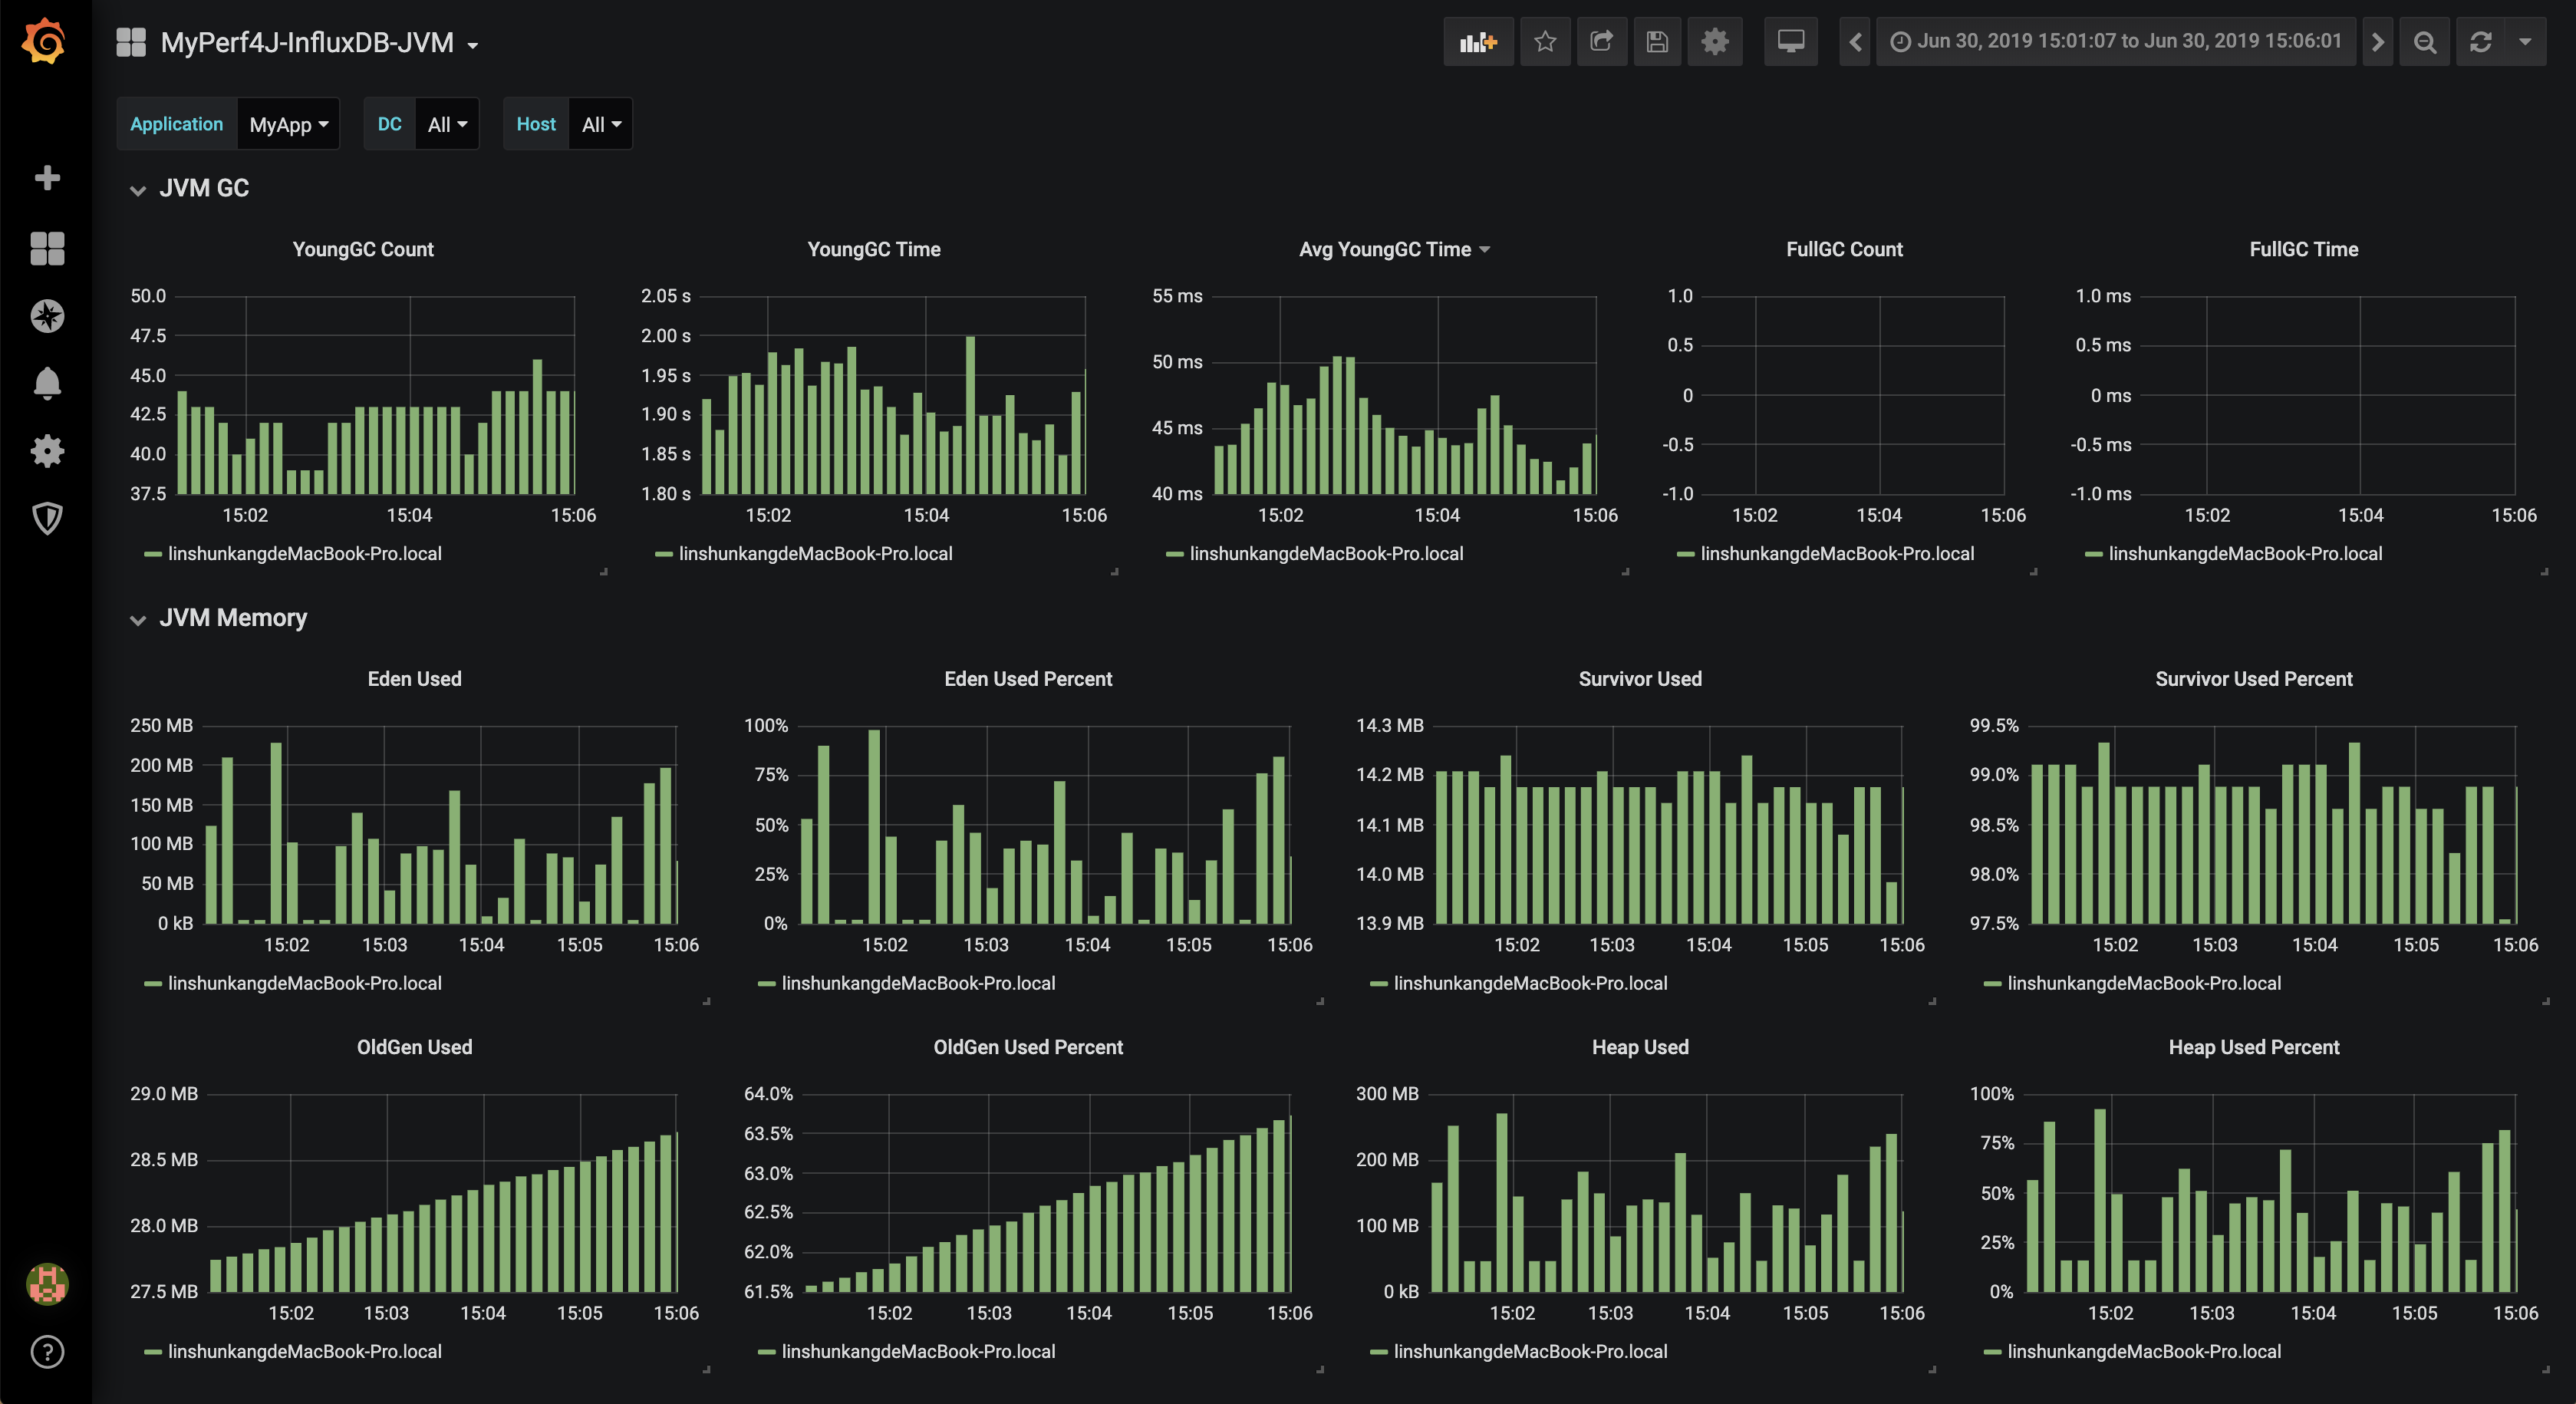
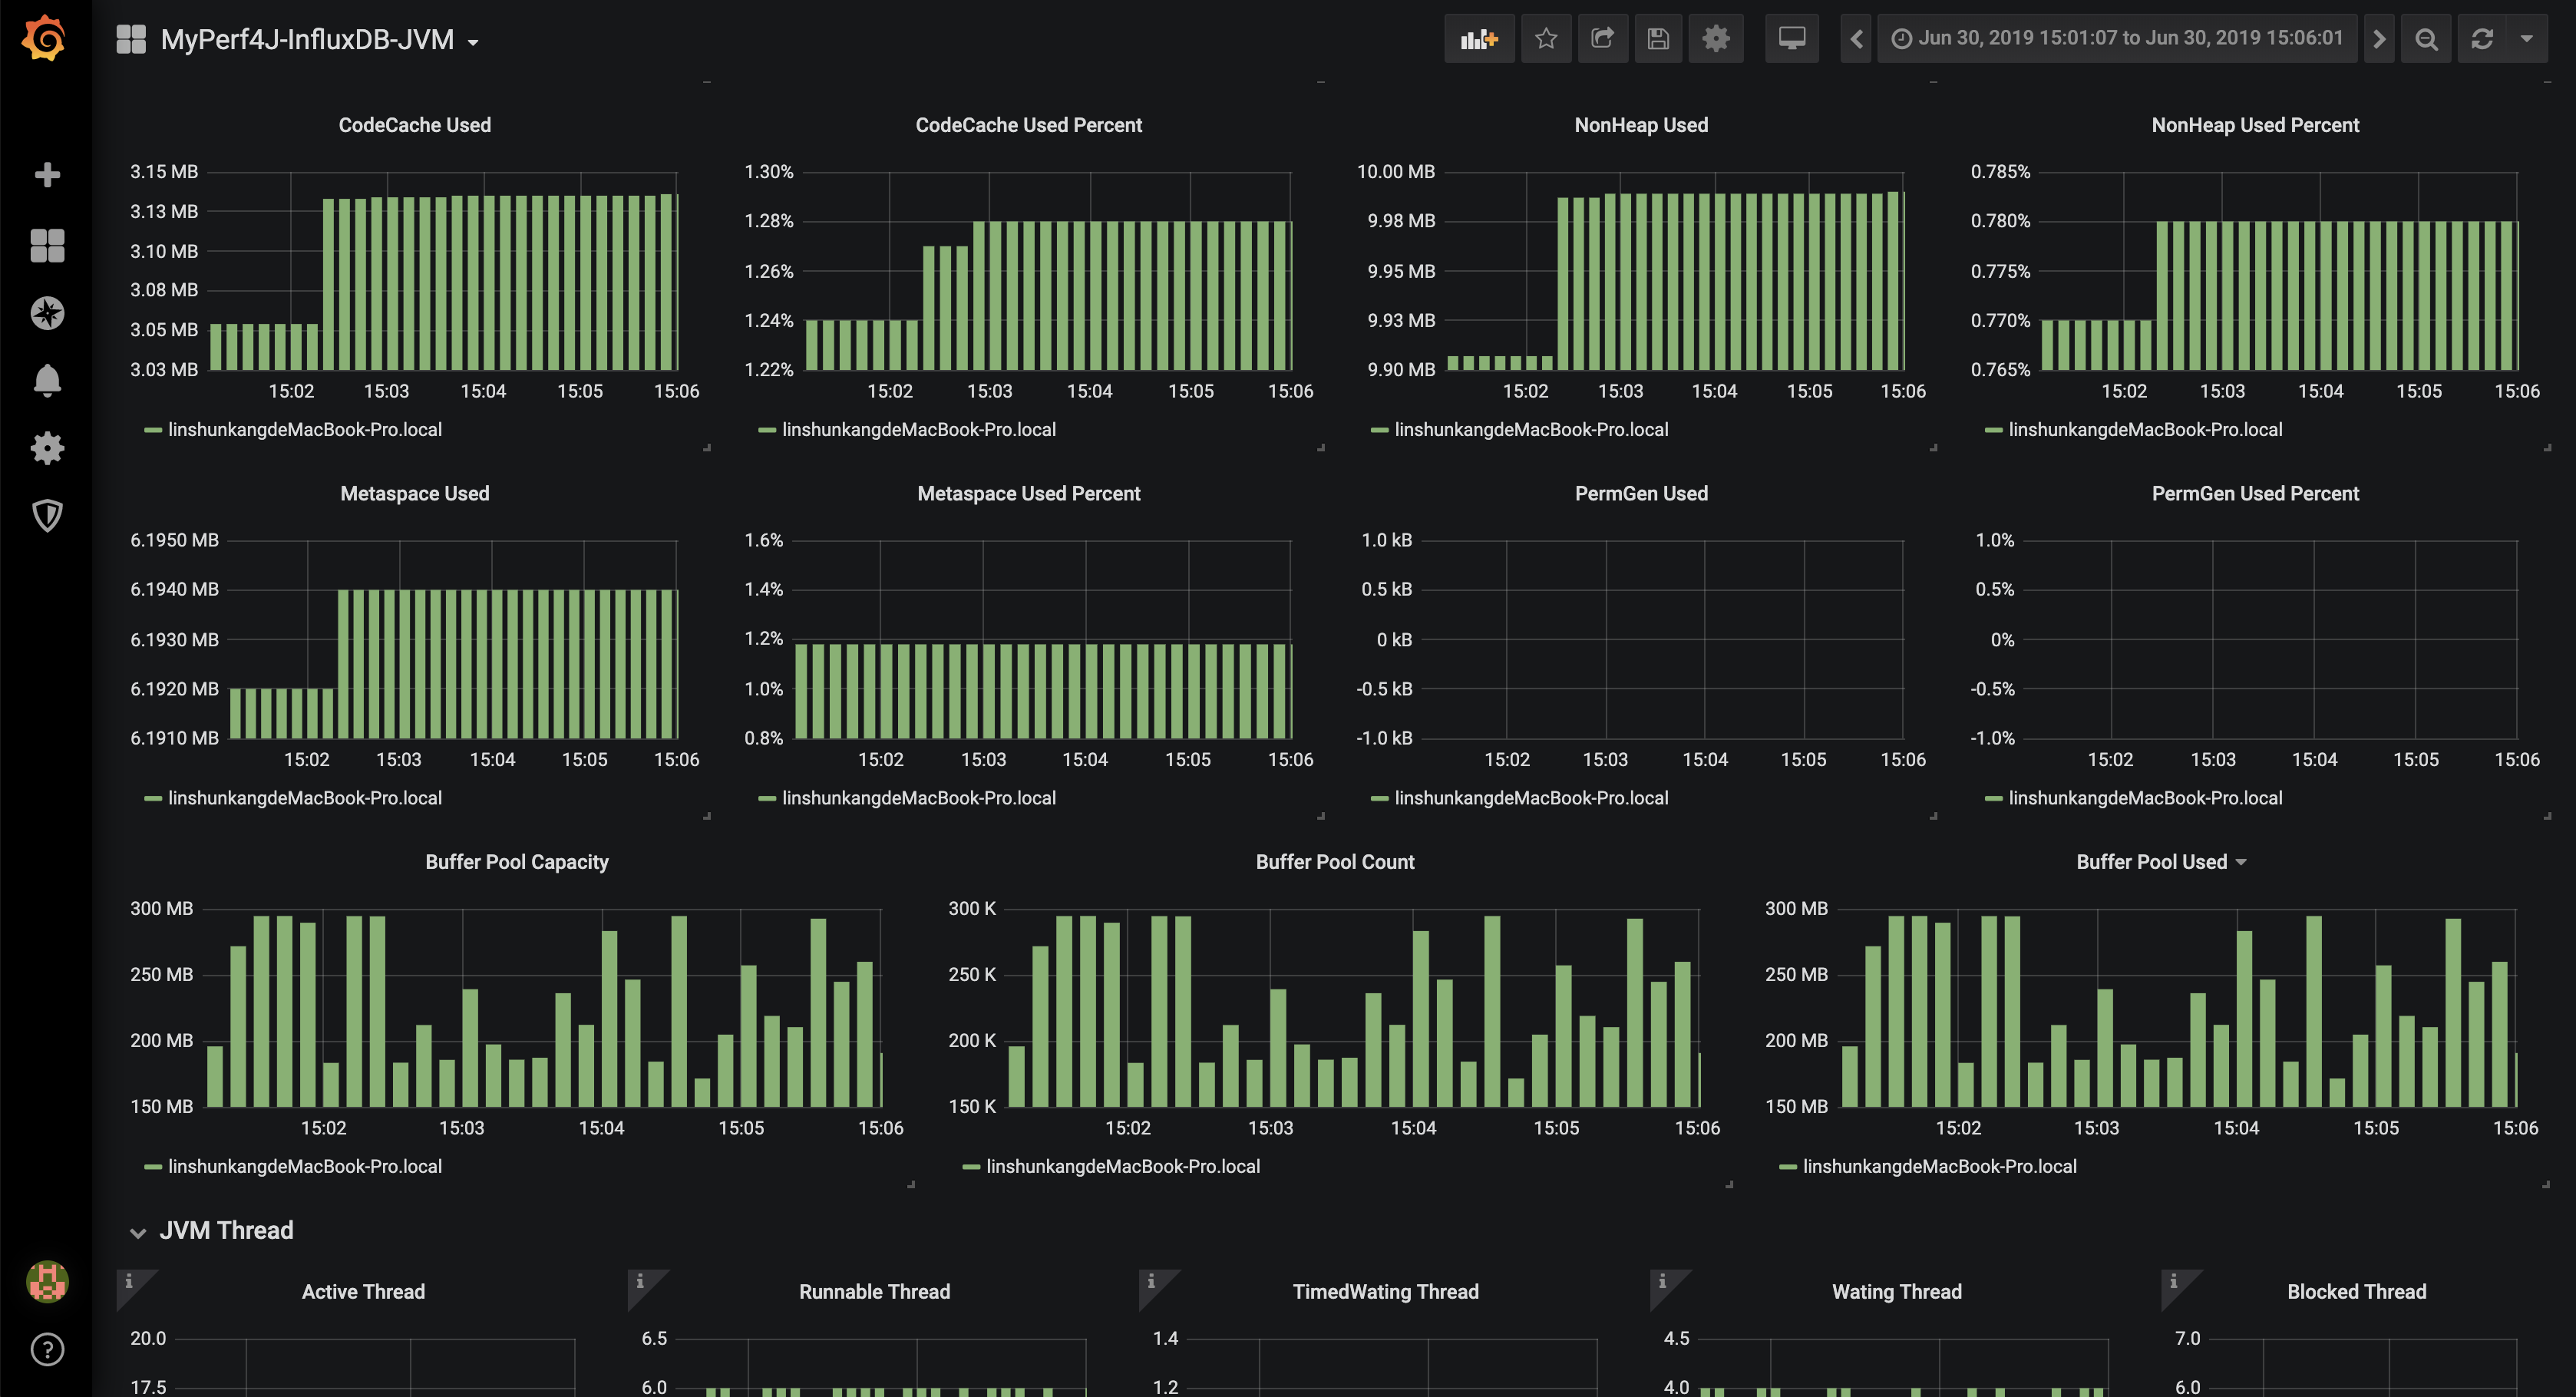
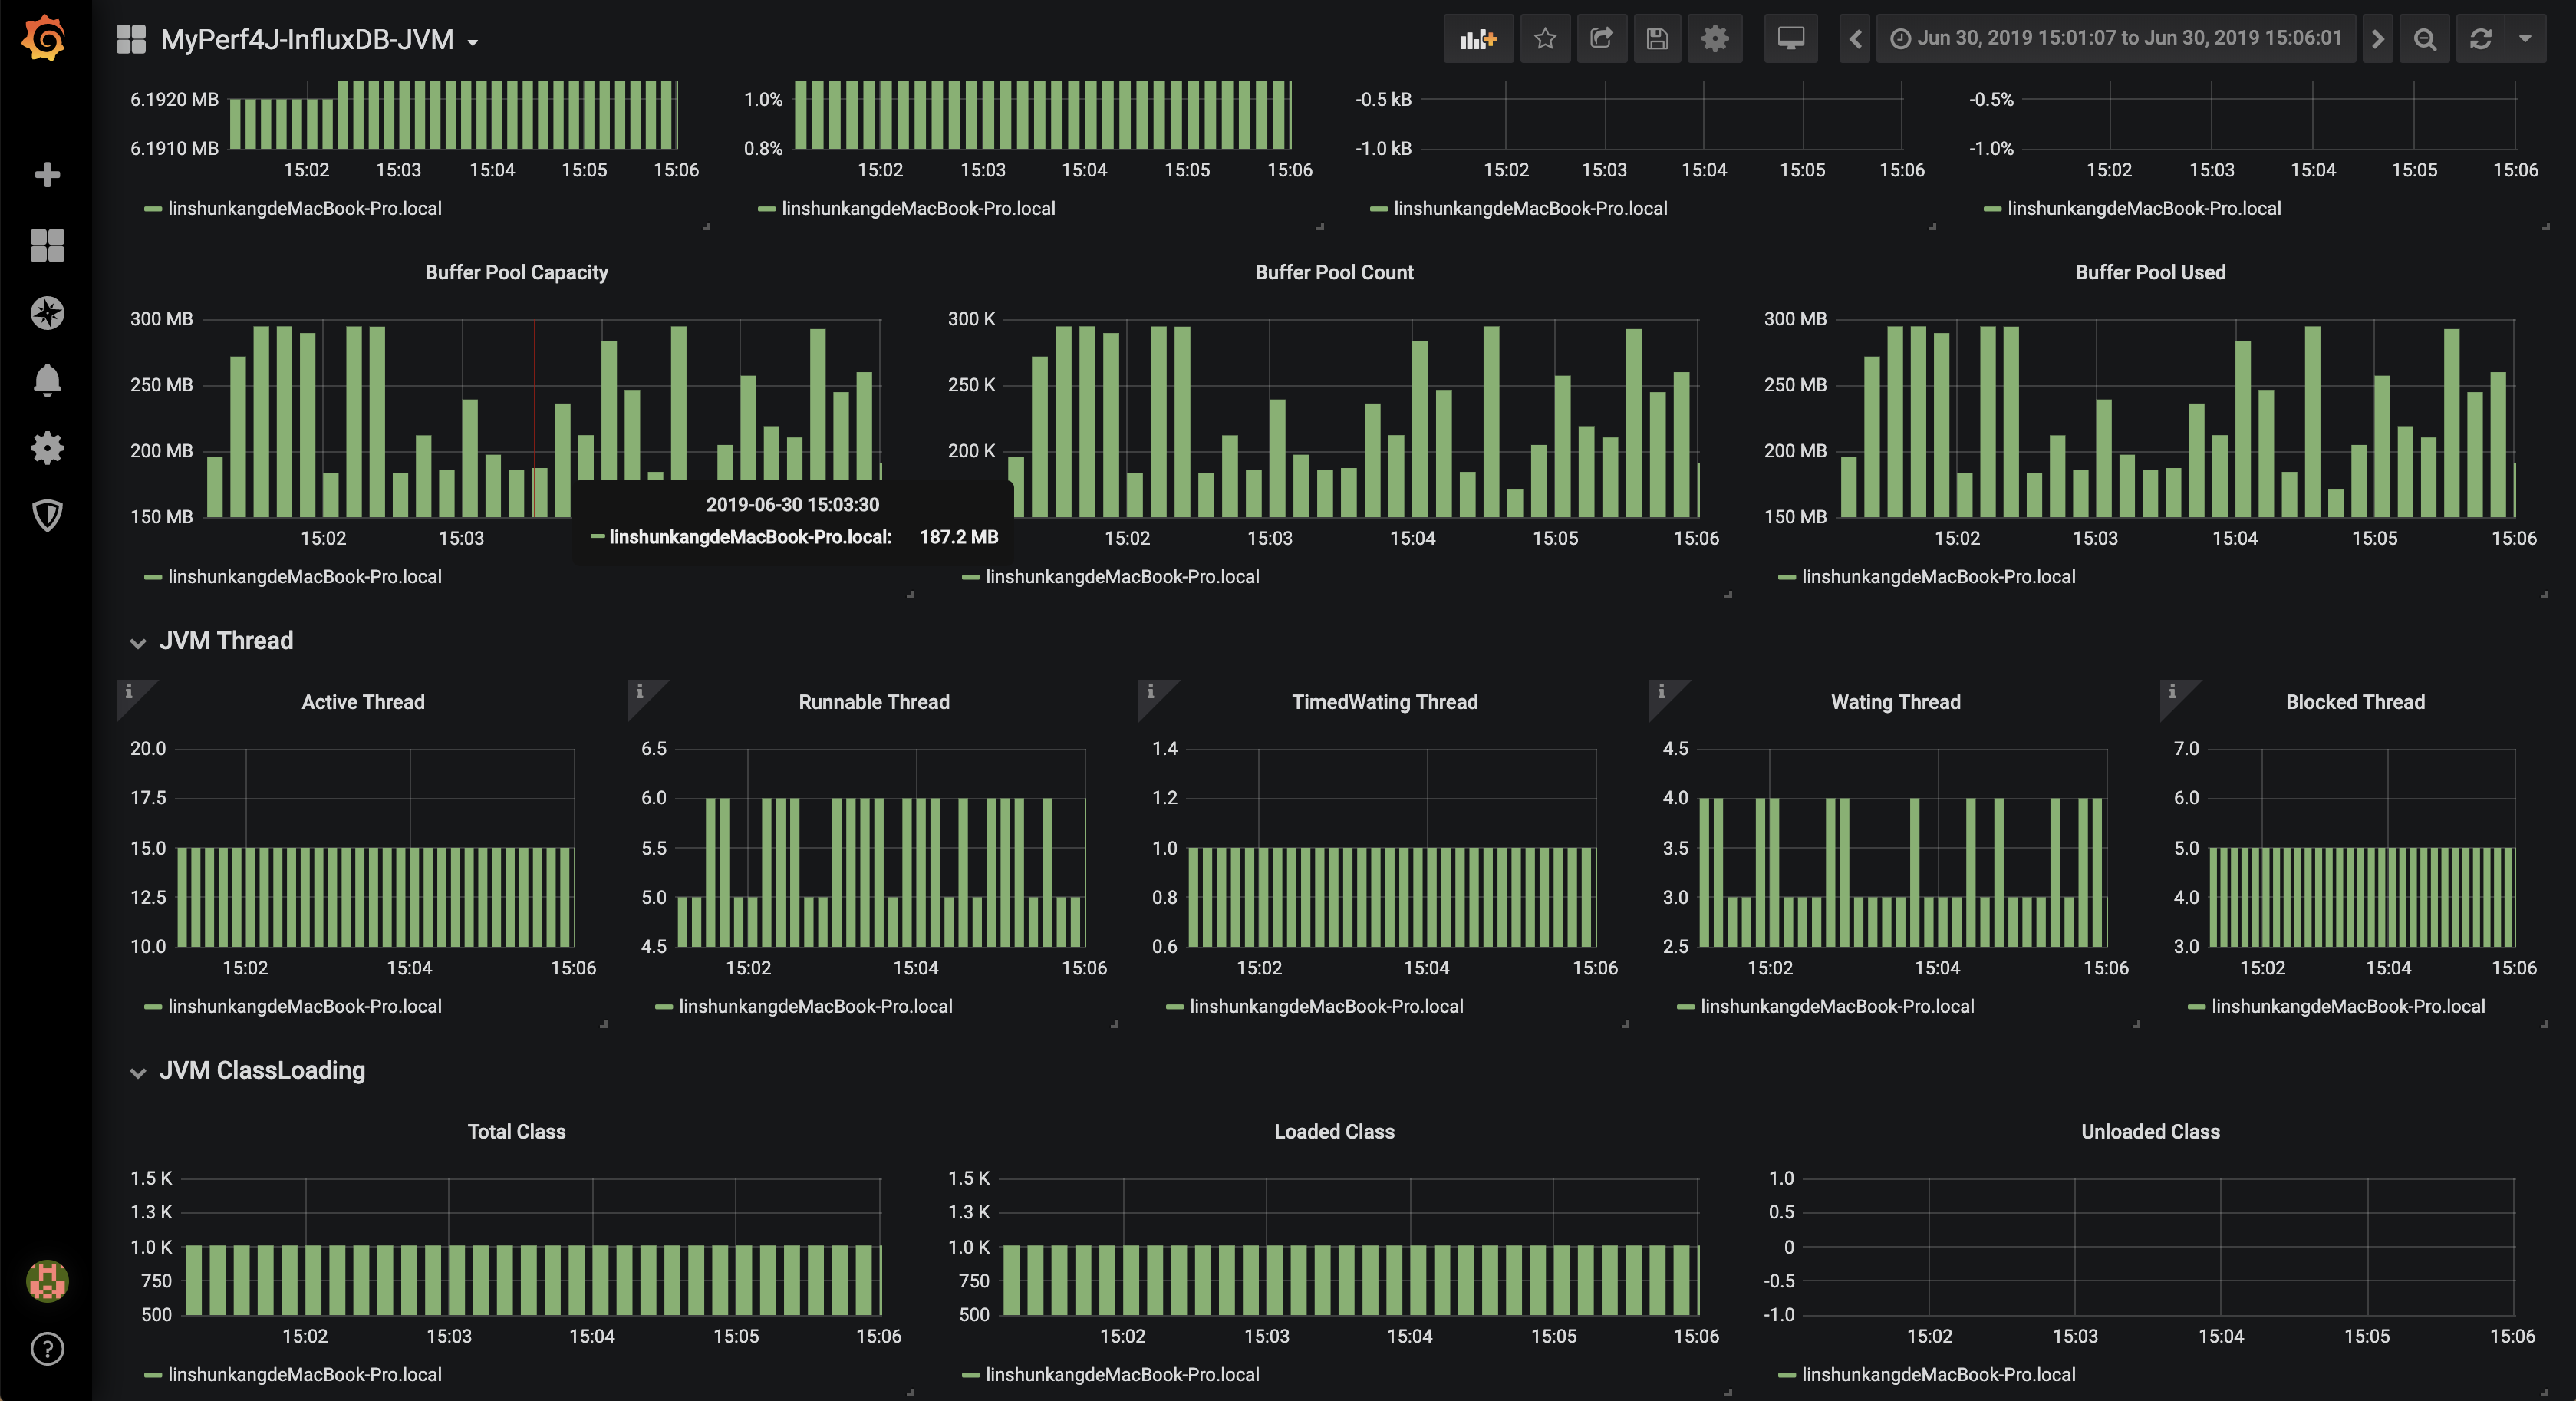
The MyPerf4J-InfluxDBv1.x-JVM dashboard uses the influxdb data source to create a Grafana dashboard with the graph panel.
Data source config
Collector type:
Collector plugins:
Collector config:
Revisions
Upload an updated version of an exported dashboard.json file from Grafana
| Revision | Description | Created | |
|---|---|---|---|
| Download |
Java Virtual Machine (JVM)
Easily monitor a Java virtual machine, which allows computers to run Java programs, with Grafana Cloud's out-of-the-box monitoring solution.
Learn more