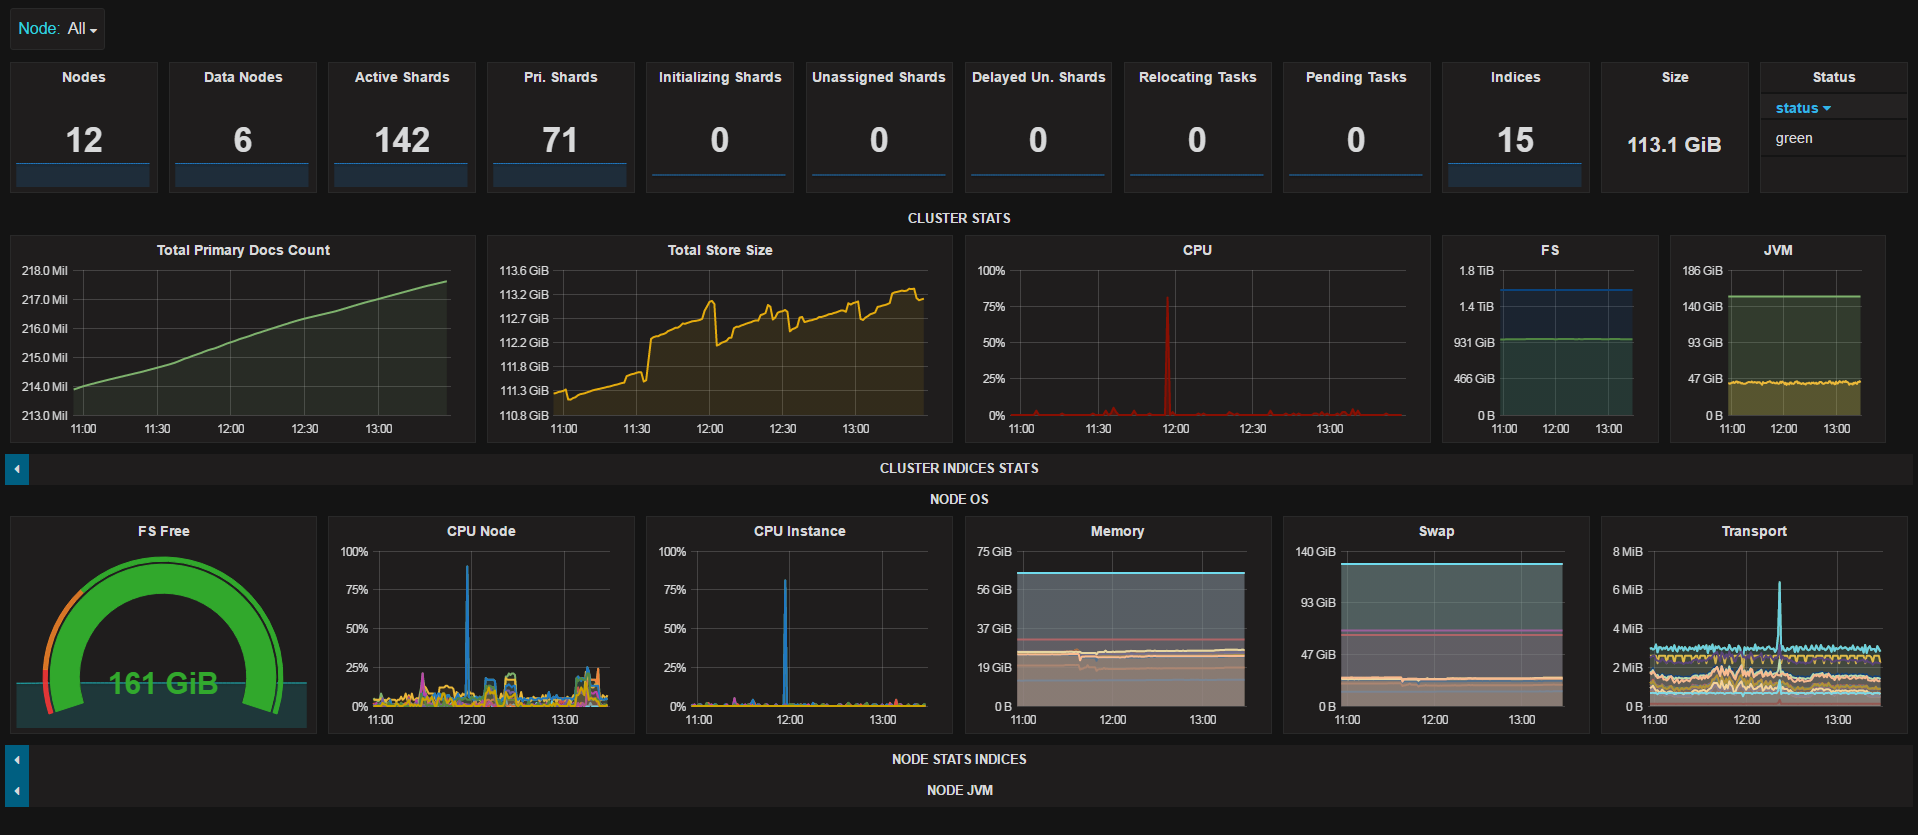
Elasticsearch Dashboard
Elasticsearch Dashboard for 2.X, 5.X and 6.X
May 31 2018
- Added a few extra graphs for disk and network transport
- Changed some graphs from per min to per second to reflect the indexing rate better.
The below python or powershell script, will collect the metrics from the Elasticsearch API based on the interval set and publish the data to Elasticsearch.
- Designed on a 24" screen (1920x1080)
- Tested this with Elasticsearch 2.4.X & 5.X
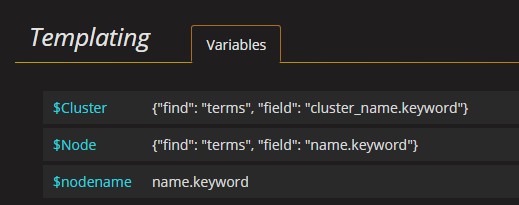
- Once loaded modify the template options to either be .raw (v2) or .keyworkd (v5) as per attached image
- Many other metrics are gathered but not yet graphed.
- Depending on your cluster size you can change the index from daily to monthly.
Python Script Download:
https://github.com/trevorndodds/elasticsearch-metrics/blob/master/Grafana/elasticsearch2elastic.py
elasticServer = os.environ.get('ES_METRICS_CLUSTER_URL', 'http://server1:9200')
interval = os.environ.get('ES_METRICS_INTERVAL', 60)
elasticIndex = os.environ.get('ES_METRICS_INDEX_NAME', 'elasticsearch_metrics')
elasticMonitoringCluster = os.environ.get('ES_METRICS_MONITORING_CLUSTER_URL', 'http://server2:9200')
Docker also available see python github page
https://github.com/trevorndodds/elasticsearch-metrics
Powershell Script download:
$elasticServer = "http://server1:9200"
$interval = 60 #If you adjust the interval you will have to adjust the "Group by time interval"
$elasticMonitoringCluster = "http://server2:9200"
Download Powershell script (requires PS version 3+) from:
Run it as a windows service using nssm - https://nssm.cc
Data source config
Collector config:
Upload an updated version of an exported dashboard.json file from Grafana
| Revision | Description | Created | |
|---|---|---|---|
| Download |
Elasticsearch
Easily monitor Elasticsearch, a distributed, multitenant full-text search engine, with Grafana Cloud's out-of-the-box monitoring solution.
Learn more