
ClickHouse overview
ClickHouse Database dashboard based on Prometheus
ClickHouse is a modern and free analytic DBMS for big data. ClickHouse manages extremely large volumes of data in a stable and sustainable manner. It currently powers Yandex.Metrica, world’s second largest web analytics platform, with over 13 trillion database records and over 20 billion events a day, generating customized reports on-the-fly, directly from non-aggregated data. It is available at https://clickhouse.yandex/
Dashboard allow to monitor:
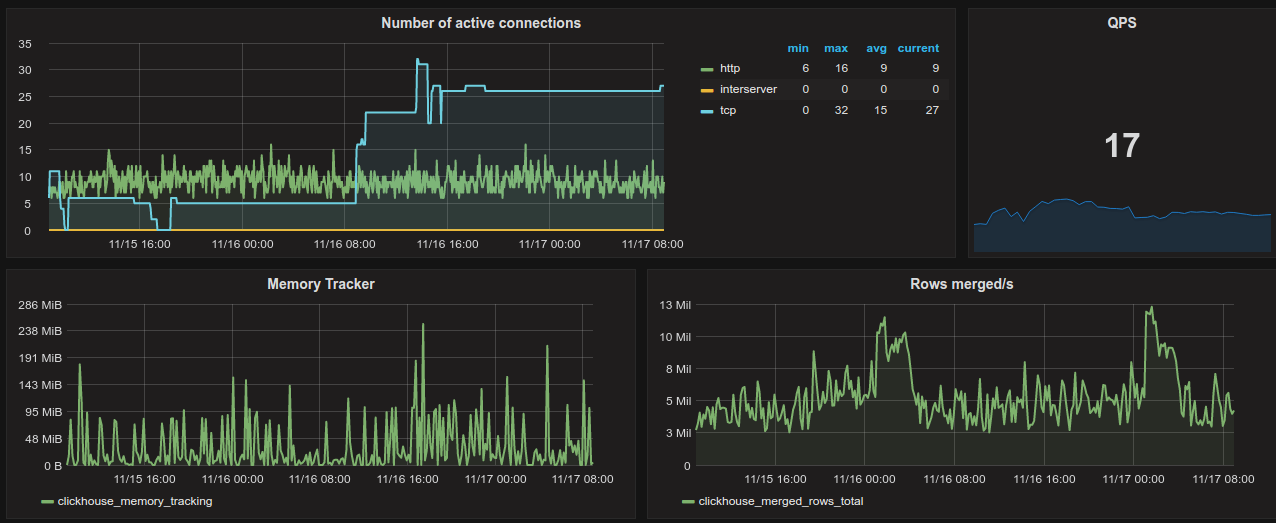
- total qps based on query execution
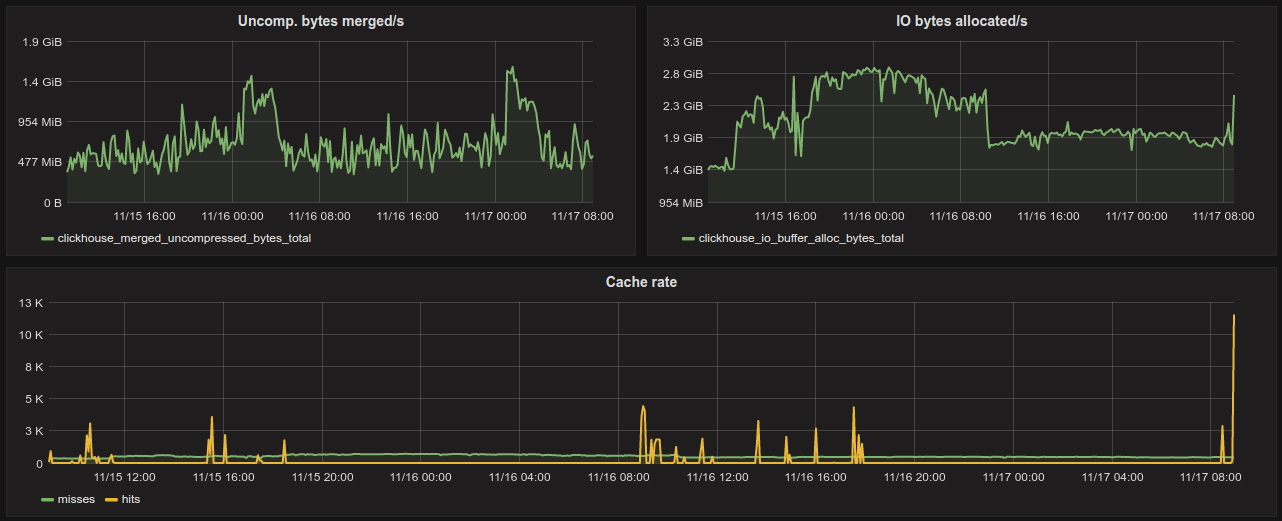
- cache hits/miss rate graph
- number of active connections
- bytes merged/allocated rate
The author assumes that the metrics are scraped from various hosts and databases. That’s why there are placed two templates: $host and $db. Remember to adjust templates for your needs at “/dashboard/db/
Metrics based on system ClickHouse tables: events and metrics.
Requirements: Dashboard is based on the https://github.com/roistat/go-clickhouse metrics
Data source config
Collector config:
Dashboard revisions
Upload an updated version of an exported dashboard.json file from Grafana
| Revision | Decscription | Created | |
|---|---|---|---|
| Download |
Get this dashboard
Data source:
Dependencies: