Elasticsearch Monitoring based on X-Pack stats
Elasticsearch monitoring based on internal X-Pack statistics - no agent needed
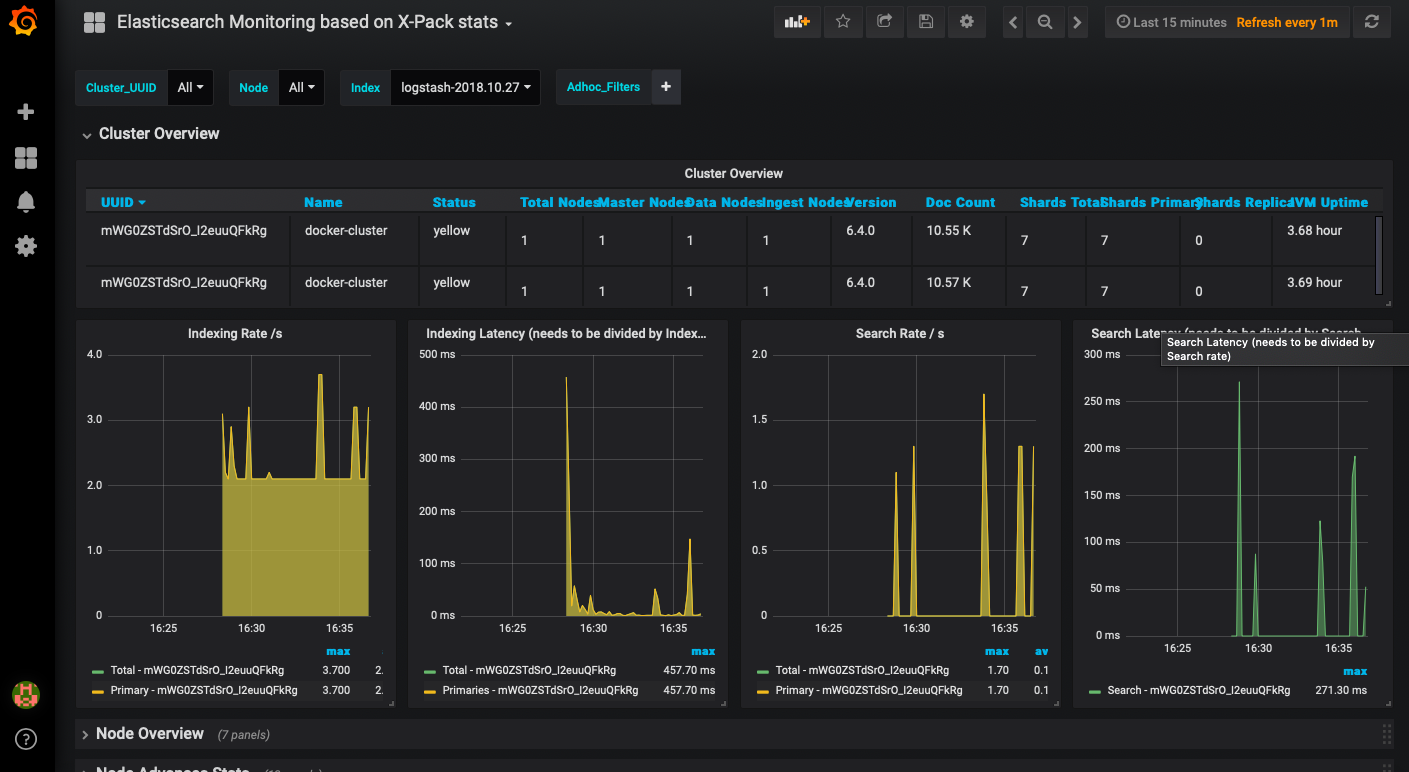
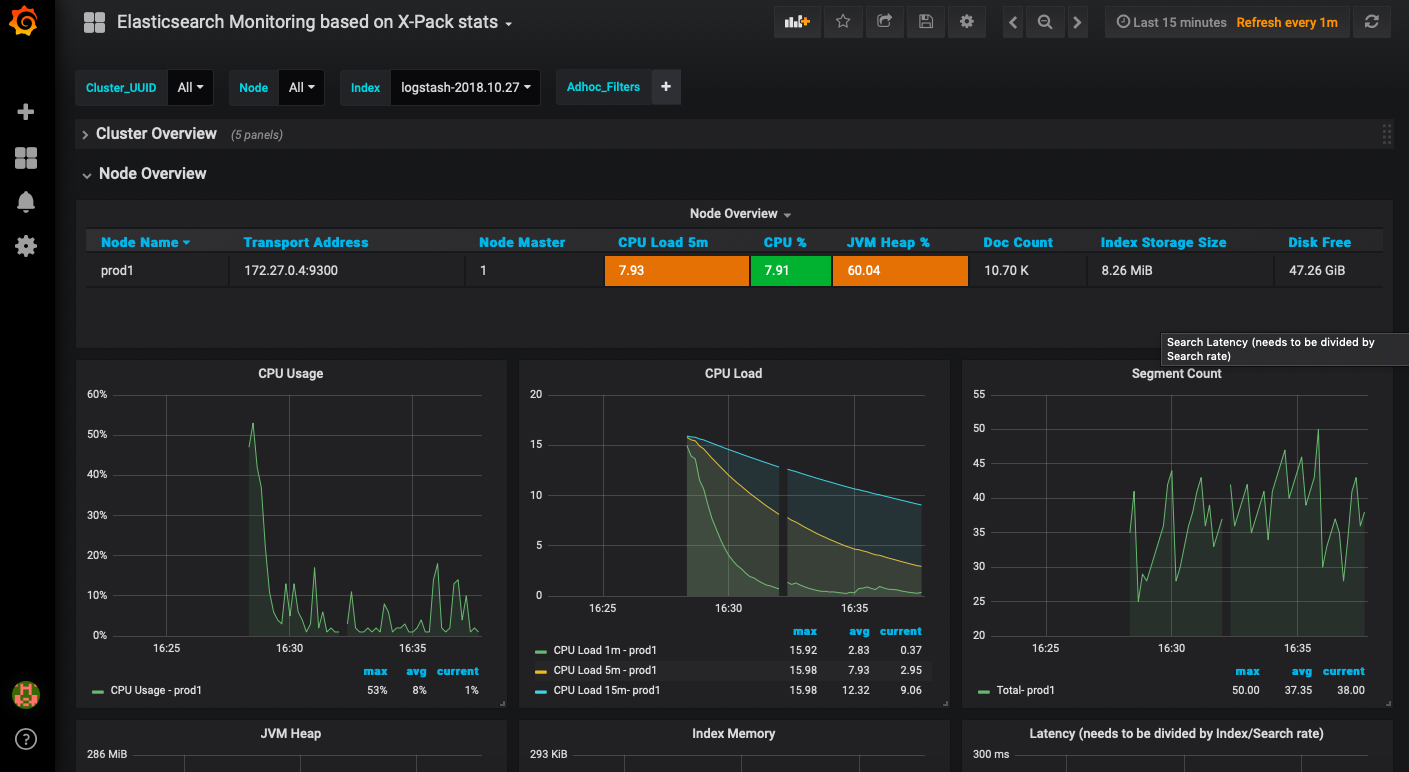
Elasticsearch provides internal statistics based on X-Pack, which comes for free. Those statistics are written to an Elasticsearch index (per default [.monitoring-es-6-]YYYY.MM.DD) and can be viewed in Grafana easily. No additional client or exporter is needed. More information on how to enable the internal Elasticsearch statistics can be found here:
https://www.elastic.co/guide/en/elasticsearch/reference/current/configuring-monitoring.html
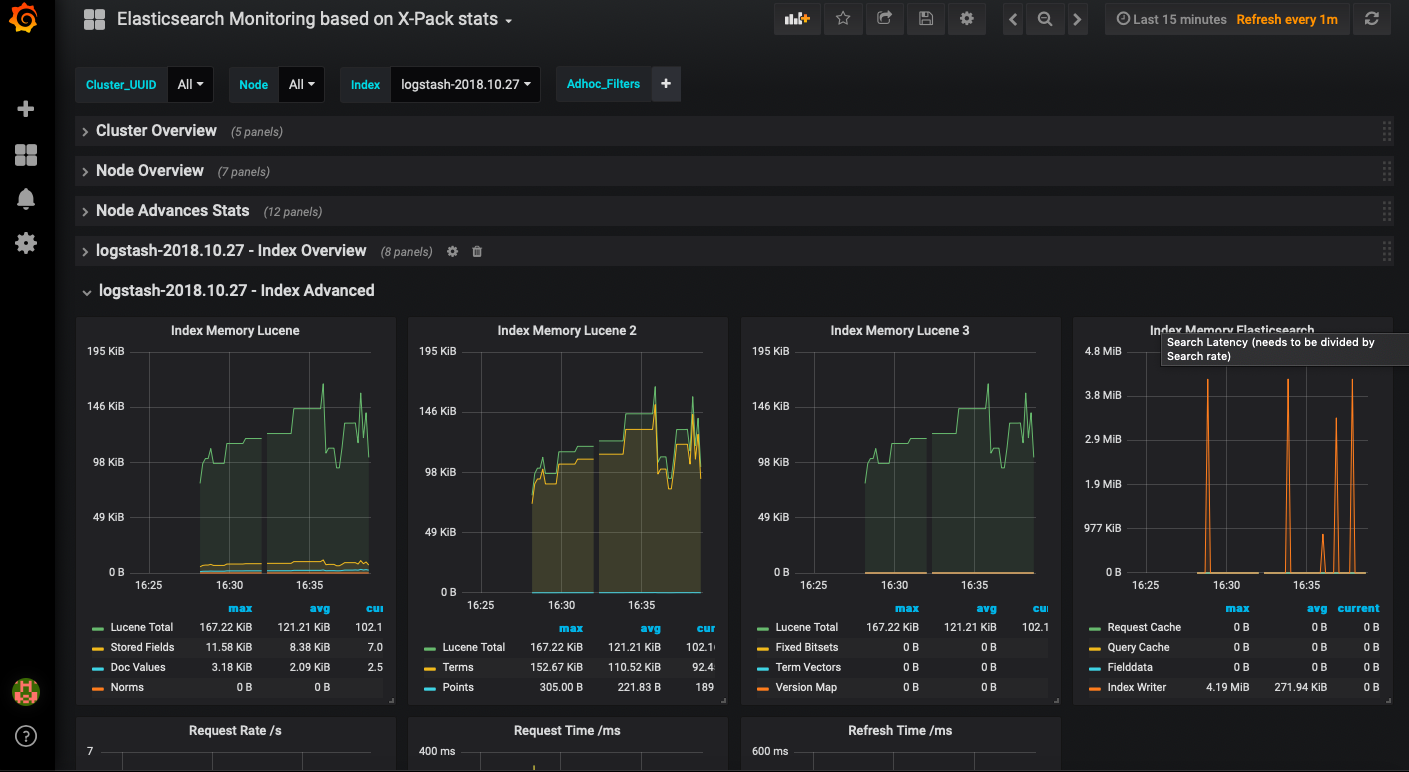
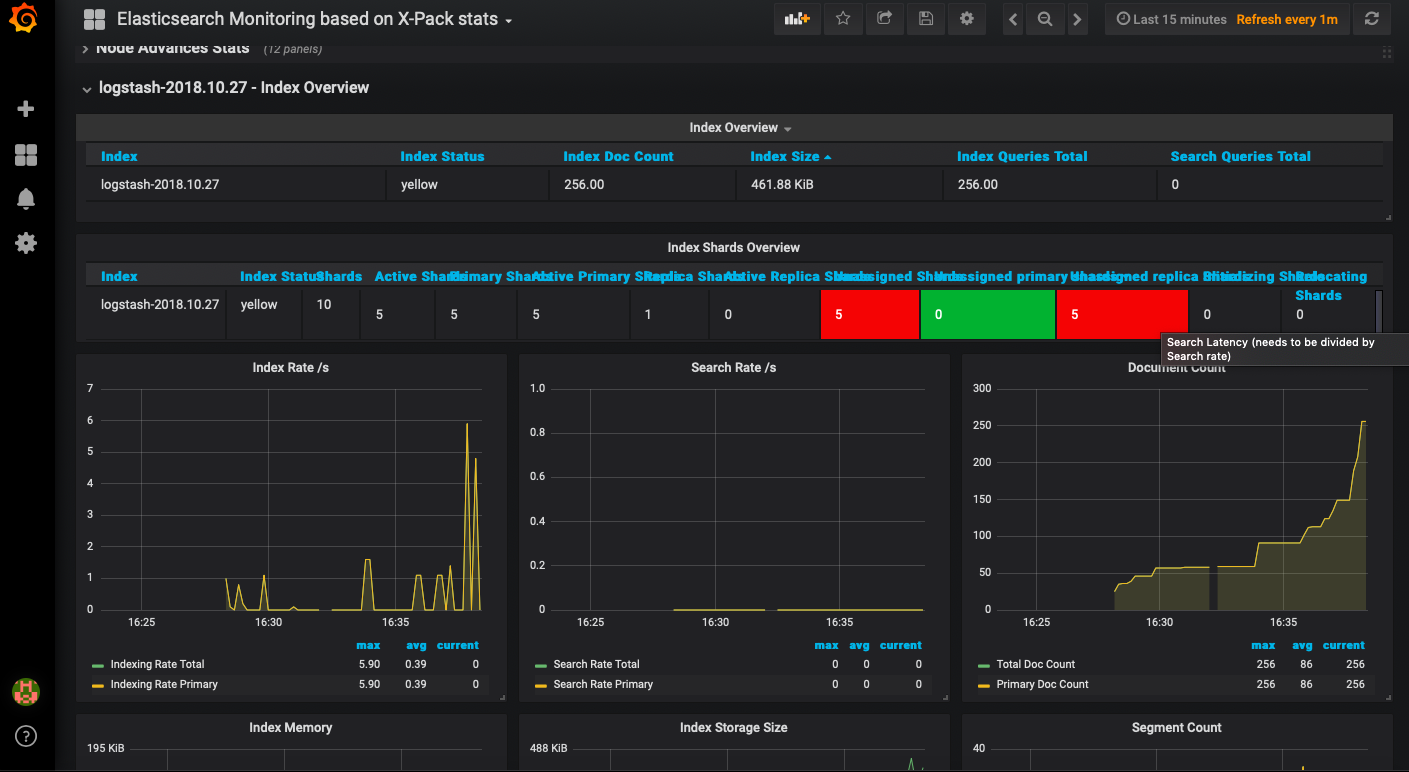
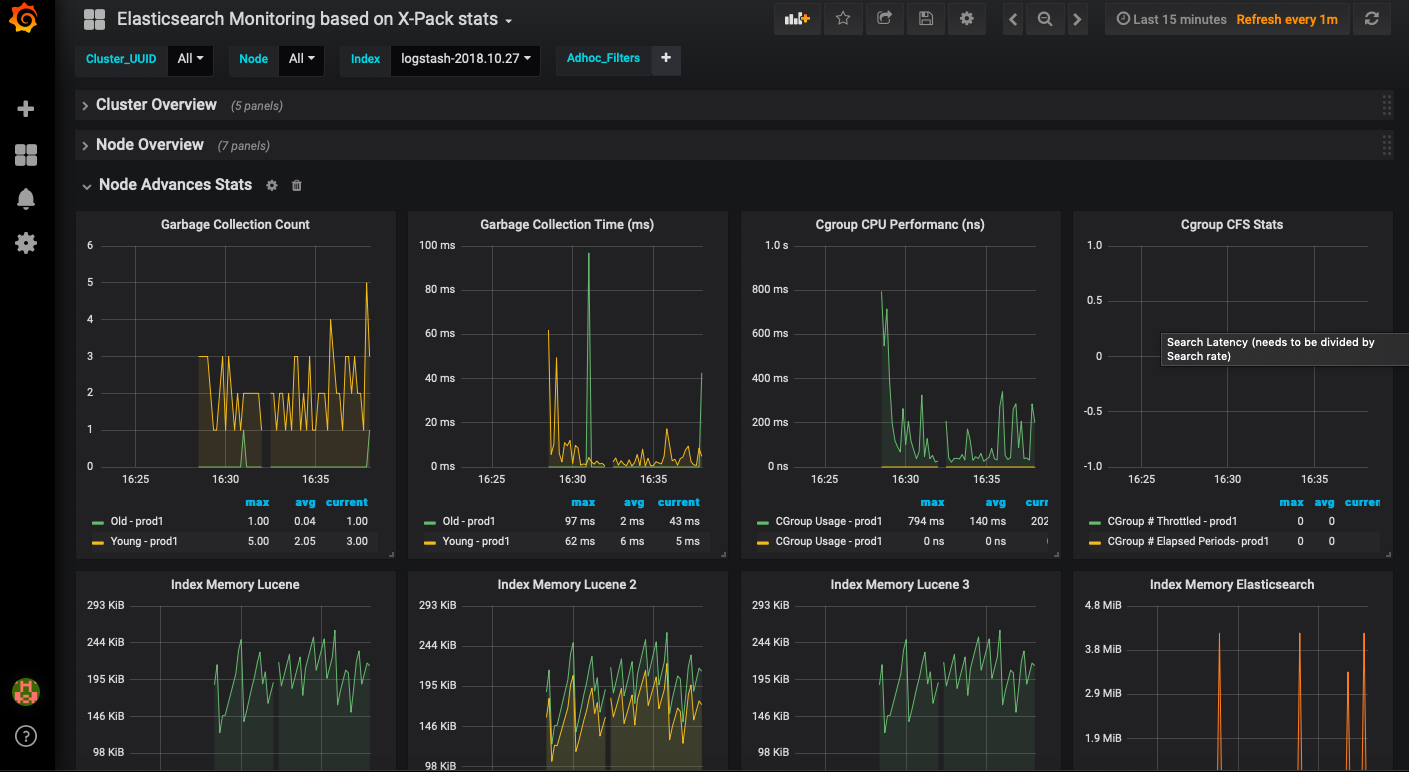
The metrics found in this dashboard are based on the ones available in the official Kibana Dashboard for monitoring Elasticsearch. If you have multiple Clusters and Nodes you can select them via variable. Moreover there are Index Overview and Index Advanced stats which do have repeating panels per Index (you can also select an Index via variable). A small drawback is that latency values are calculated as: search/index latency divided by search/index rate. This is something Grafana does not support for Elasticsearch datasources at the moment. So the latency values in this dashboard are not divided by rates.
If you would like to see the dashboard in action - you can bring up a Grafana-PLEI stack (Grafana bundled with (P)rometheus, (L)ogstash, (E)lasicsearch & (I)nfluxDB) with docker-compose and try it yourself. You can find it here:
https://github.com/crab86/grafana-plei
Moreover you can open issues and pull requests regarding this dashboard or the PLEI stack via this GitHub repo.
Data source config
Collector config:
Upload an updated version of an exported dashboard.json file from Grafana
| Revision | Description | Created | |
|---|---|---|---|
| Download |
Elasticsearch
Easily monitor Elasticsearch, a distributed, multitenant full-text search engine, with Grafana Cloud's out-of-the-box monitoring solution.
Learn more