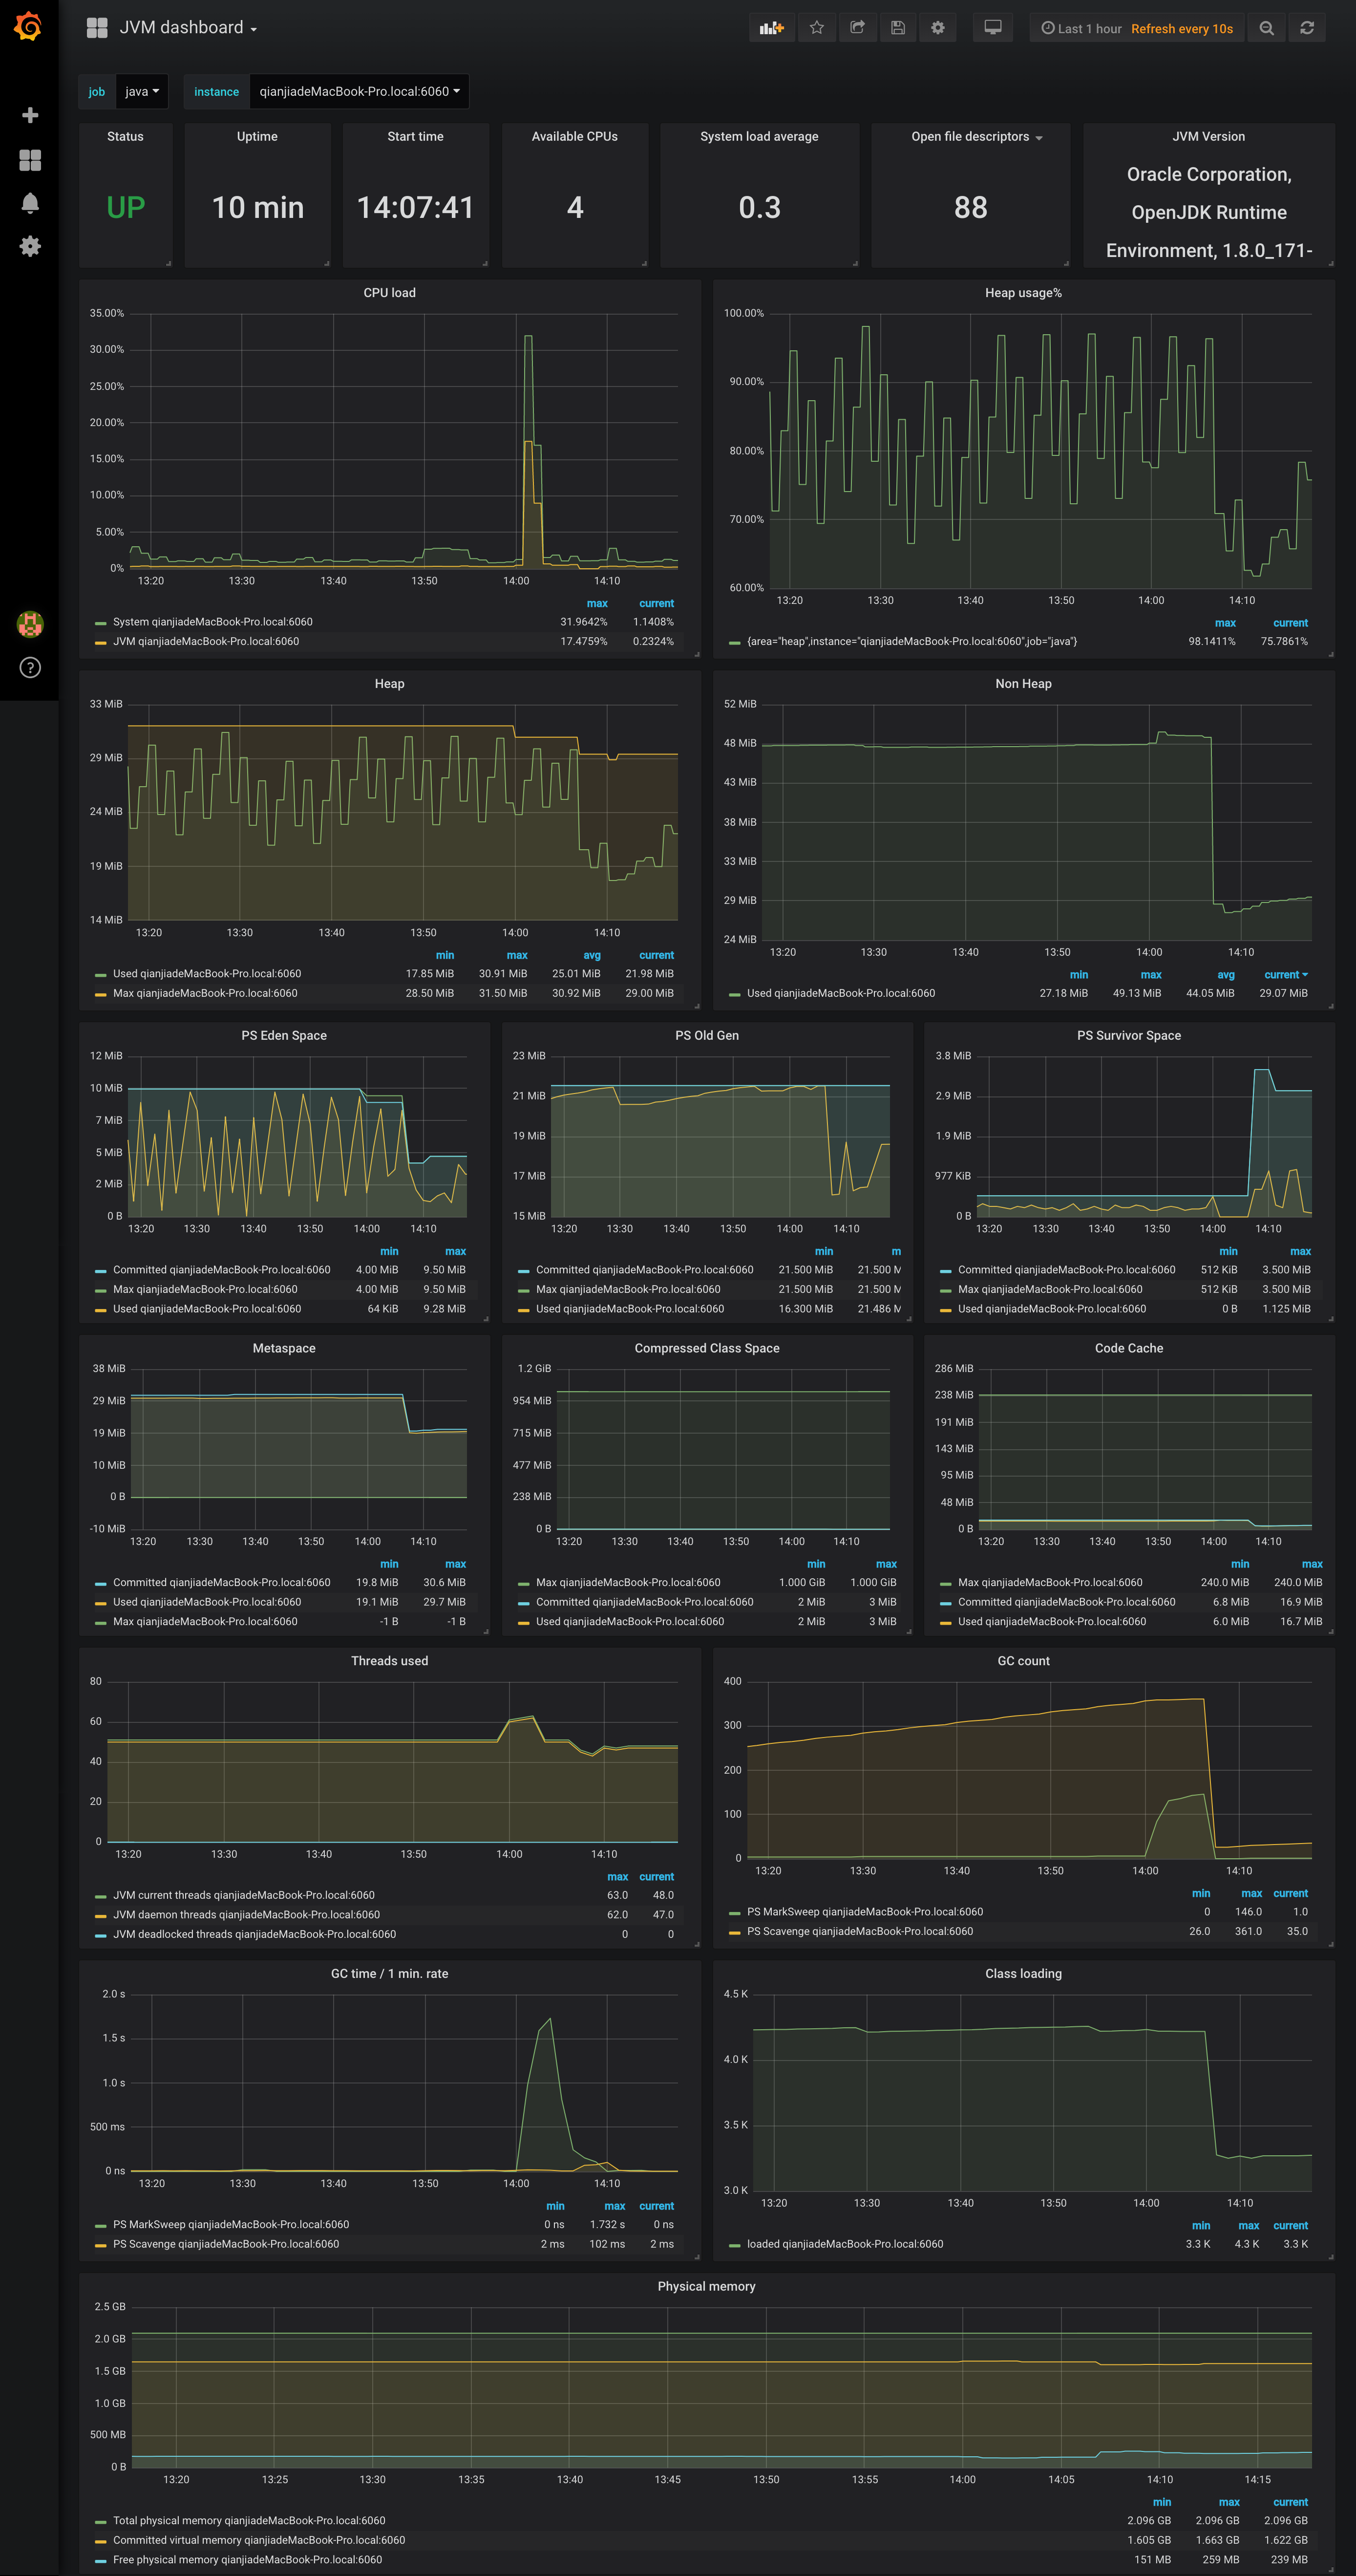
JVM dashboard
Complete dashboard using metrics from prometheus JMX exporter, with drill down per job > instance
Gist is here
Based on JMX exporter prometheus.
Dashboard for jvm_* metrics which are exported by JMX exporter.
Prometheus with config example:
scrape_configs:
  - job_name: 'java'
    static_configs:
    - targets: ['<host>:<port>']
You can change config file's job_name and dashboard's job constant variable correspondingly.
jmx-exporter config example:
---
lowercaseOutputLabelNames: true
lowercaseOutputName: true
whitelistObjectNames: ["java.lang:type=OperatingSystem"]
blacklistObjectNames: []
rules:
  - pattern: 'java.lang<type=OperatingSystem><>(committed_virtual_memory|free_physical_memory|free_swap_space|total_physical_memory|total_swap_space)_size:'
    name: os_$1_bytes
    type: GAUGE
    attrNameSnakeCase: true
  - pattern: 'java.lang<type=OperatingSystem><>((?!process_cpu_time)\w+):'
    name: os_$1
    type: GAUGE
    attrNameSnakeCase: true
Data source config
Collector type:
Collector plugins:
Collector config:
Revisions
Upload an updated version of an exported dashboard.json file from Grafana
| Revision | Description | Created | |
|---|---|---|---|
| Download |
Java Virtual Machine (JVM)
Easily monitor a Java virtual machine, which allows computers to run Java programs, with Grafana Cloud's out-of-the-box monitoring solution.
Learn more