
RabbitMQ Monitoring
Rabbitmq stats and alerting using Telegraf (with Elasticsearch as datasource)
RabbitMQ Dashboard
Display RabbitMQ monitoring graph based on Influxdb/Telegraf collector stored in Elasticsearch
Node stats used
Below is list of rows in the dashboard and measurements and fields required by the graphs in the row:
Variables
rabbitmq_noderabbitmq_queuerabbitmq_exchange
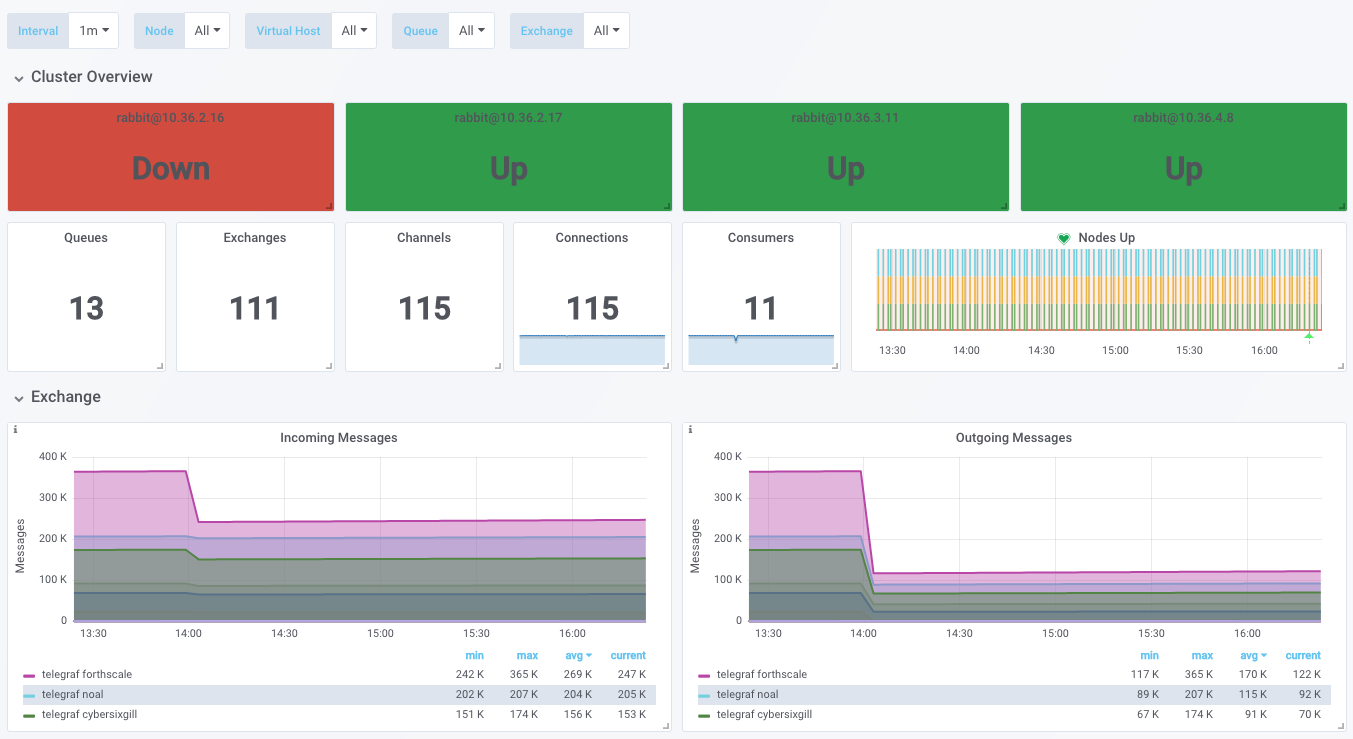
Cluster Overview
rabbitmq_noderabbitmq_overview
Exchange
rabbitmq_exchange
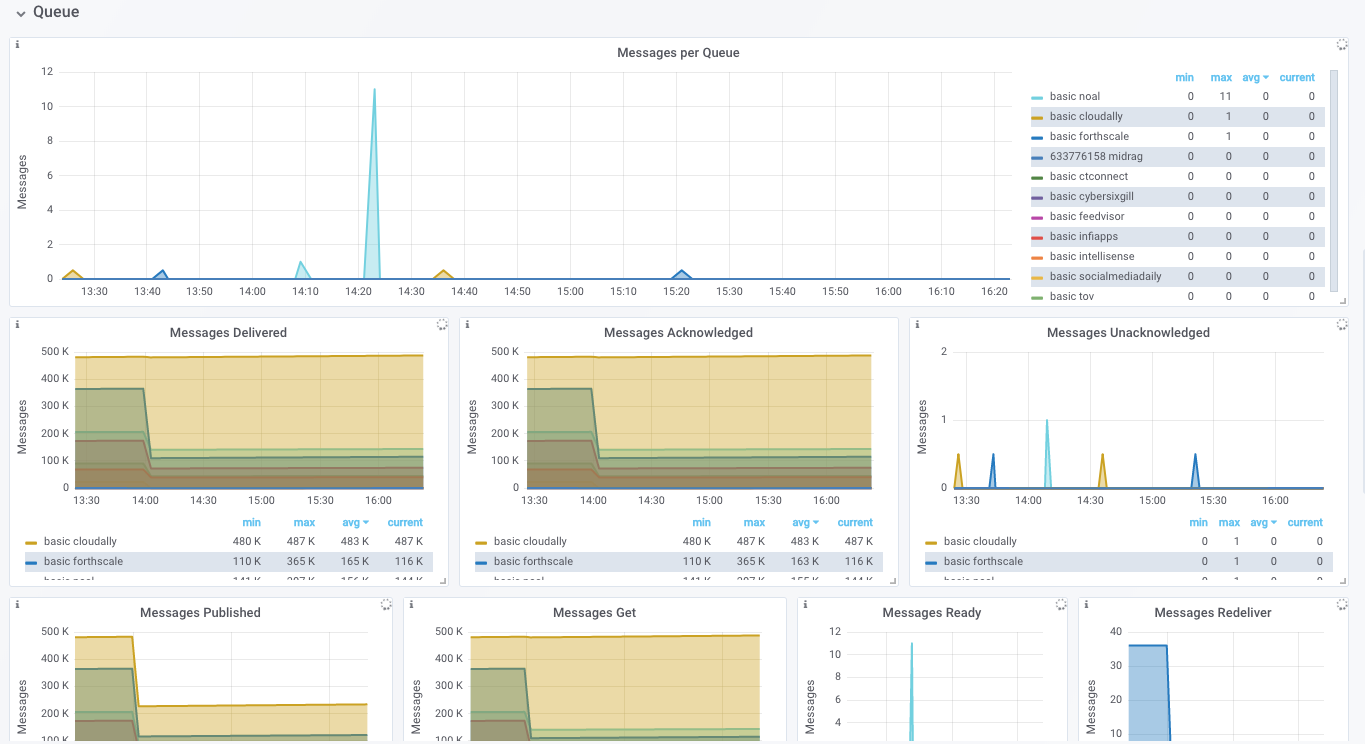
Queue
rabbitmq_queue
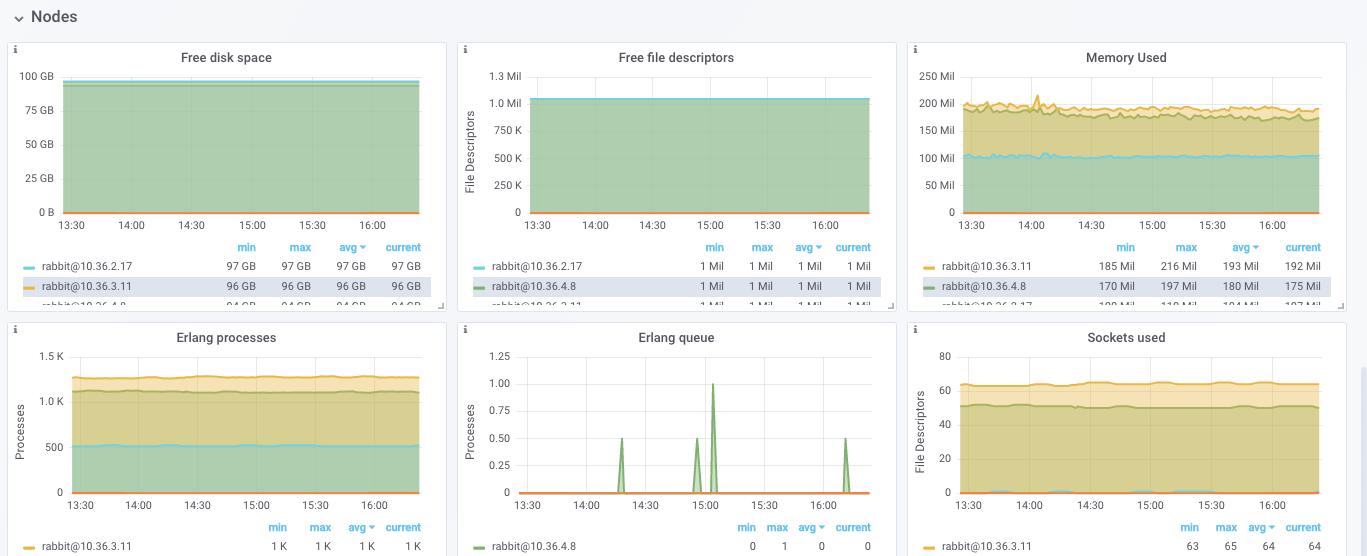
Nodes
rabbitmq_node
Data source config
Collector type:
Collector plugins:
Collector config:
Dashboard revisions
Upload an updated version of an exported dashboard.json file from Grafana
| Revision | Decscription | Created | |
|---|---|---|---|
| Download |
Sign up for Grafana Cloud

Get up and running in minutes with the Grafana Cloud free tier, which includes free forever 10k metrics, 50GB logs, 50GB traces, 500 VUh, and more.
Get this dashboard
Data source:
Dependencies: