Jaeger Agent
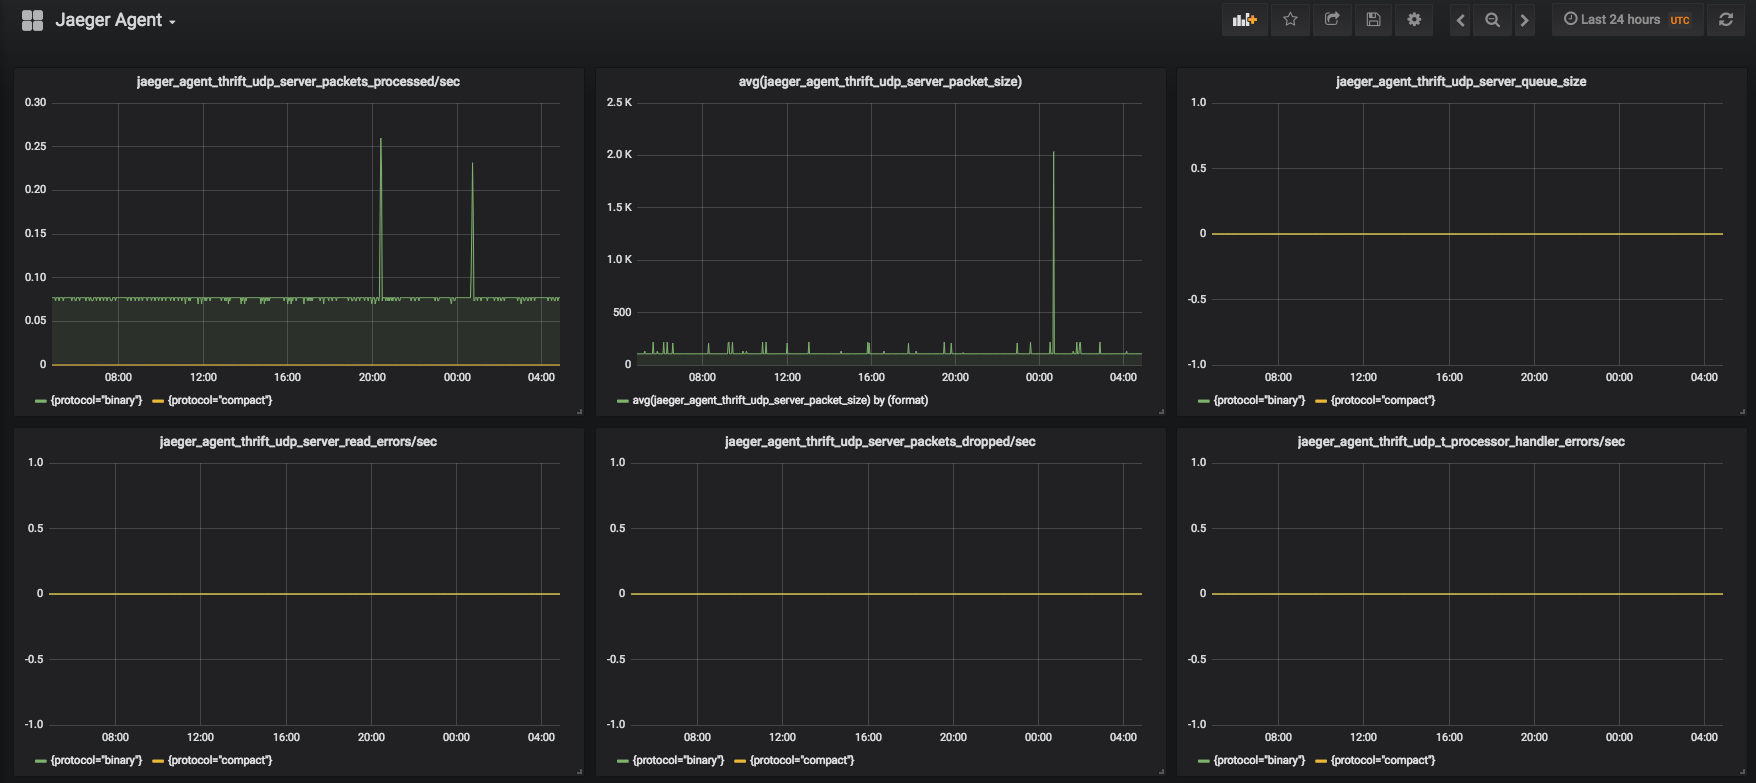
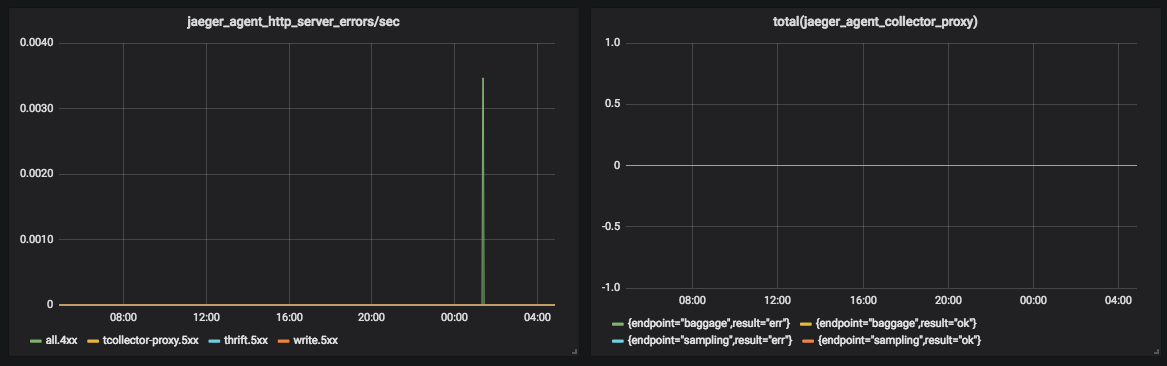
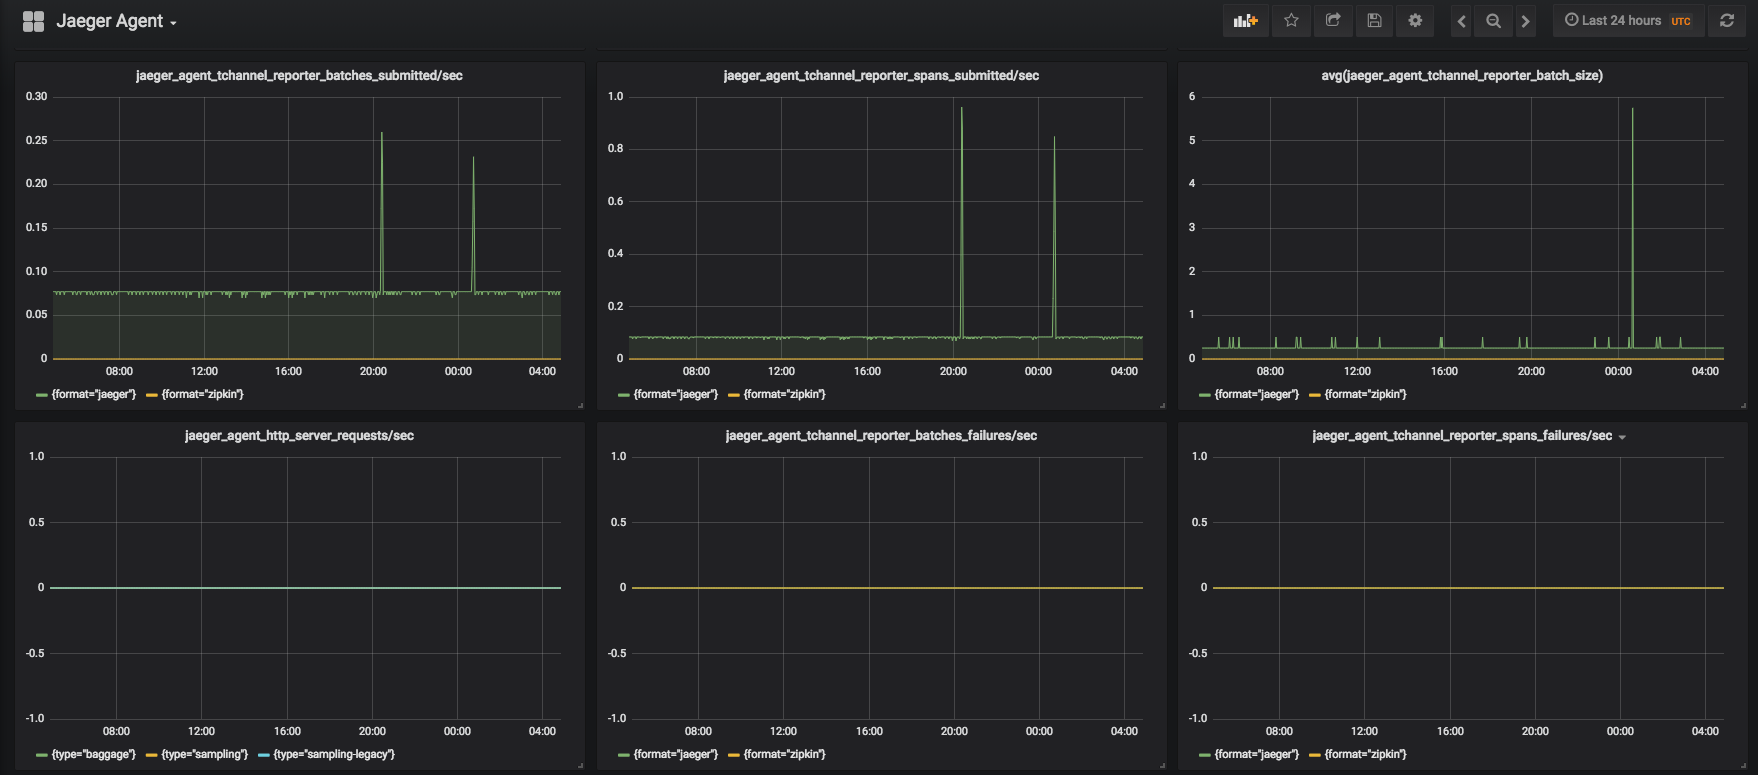
Dashboard for monitoring jaeger-agent running in a k8s environment.
- (Jaeger)[https://www.jaegertracing.io/] is an open source, end-to-end distributed tracing solution. It is a part of the Cloud Native Computing Foundation (CNCF)[https://www.cncf.io/].
- The (jaeger-agent)[https://www.jaegertracing.io/docs/1.7/deployment/#agent] is part of the Jaeger deployment architecture that runs as a sidecar/daemonset next to containers/pods, receives spans emitted by the client libraries and forwards them to the configured jaeger-collector. The agent also supplies configuration like sampling policy to client libraries.
- It is possible to deploy jaeger-agent in a kubernetes environment, for example through steps described (here)[https://github.com/jaegertracing/jaeger-kubernetes].
- This dashboard helps you monitor the health of a jaeger-agent component that is running in a kubernetes environment.
Data source config
Collector type:
Collector plugins:
Collector config:
Revisions
Upload an updated version of an exported dashboard.json file from Grafana
| Revision | Description | Created | |
|---|---|---|---|
| Download |
Grafana Agent
Easily monitor metrics and logs from a Grafana Agent instance with Grafana Cloud's out-of-the-box monitoring solution.
Learn more