Docker monitoring with node selection
Docker monitoring with Prometheus and cAdvisor with node selection
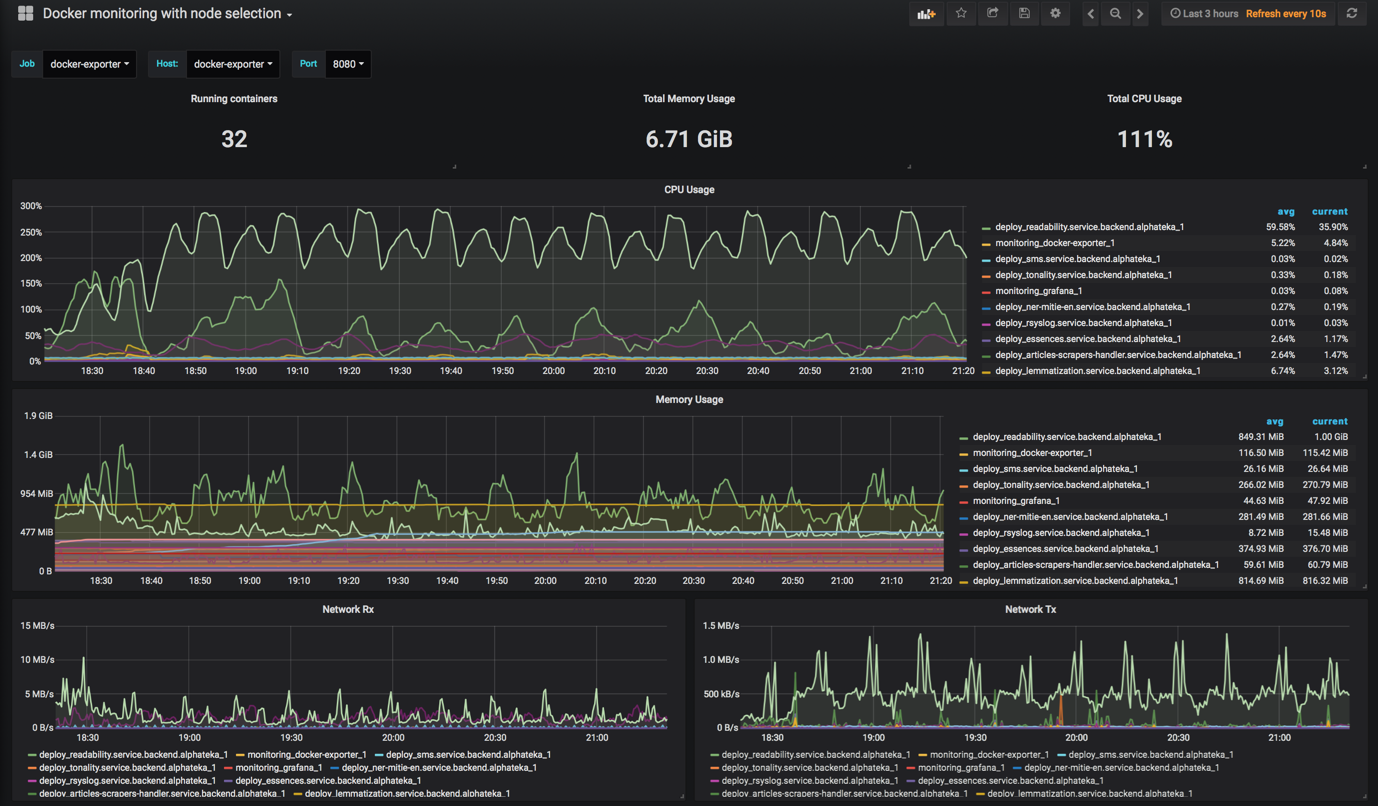
This is a dashboard for monitoring Docker container metrics collected by cAdvisor and stored in Prometheus TSDB.
Its an alternative for Docker monitoring dashboard with possibility to select target node/host and port, as well as job.
Data source config
Collector type:
Collector plugins:
Collector config:
Revisions
Upload an updated version of an exported dashboard.json file from Grafana
| Revision | Description | Created | |
|---|---|---|---|
| Download |
Docker
Easily monitor Docker with Grafana Cloud's out-of-the-box monitoring solution.
Learn more