Traefik 1.6+ - Updated
Traefik dashboard prometheus Updated version for use with treafik 1.6+
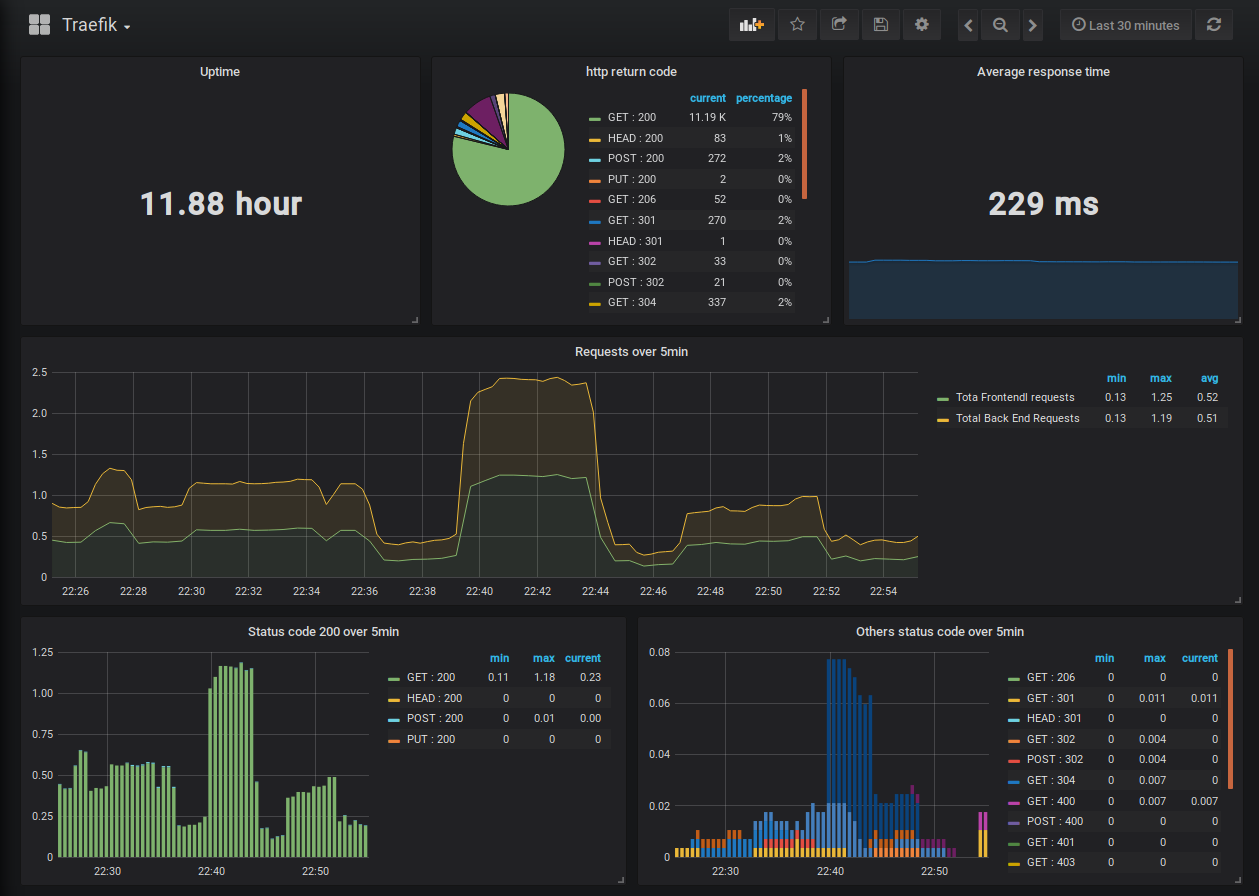
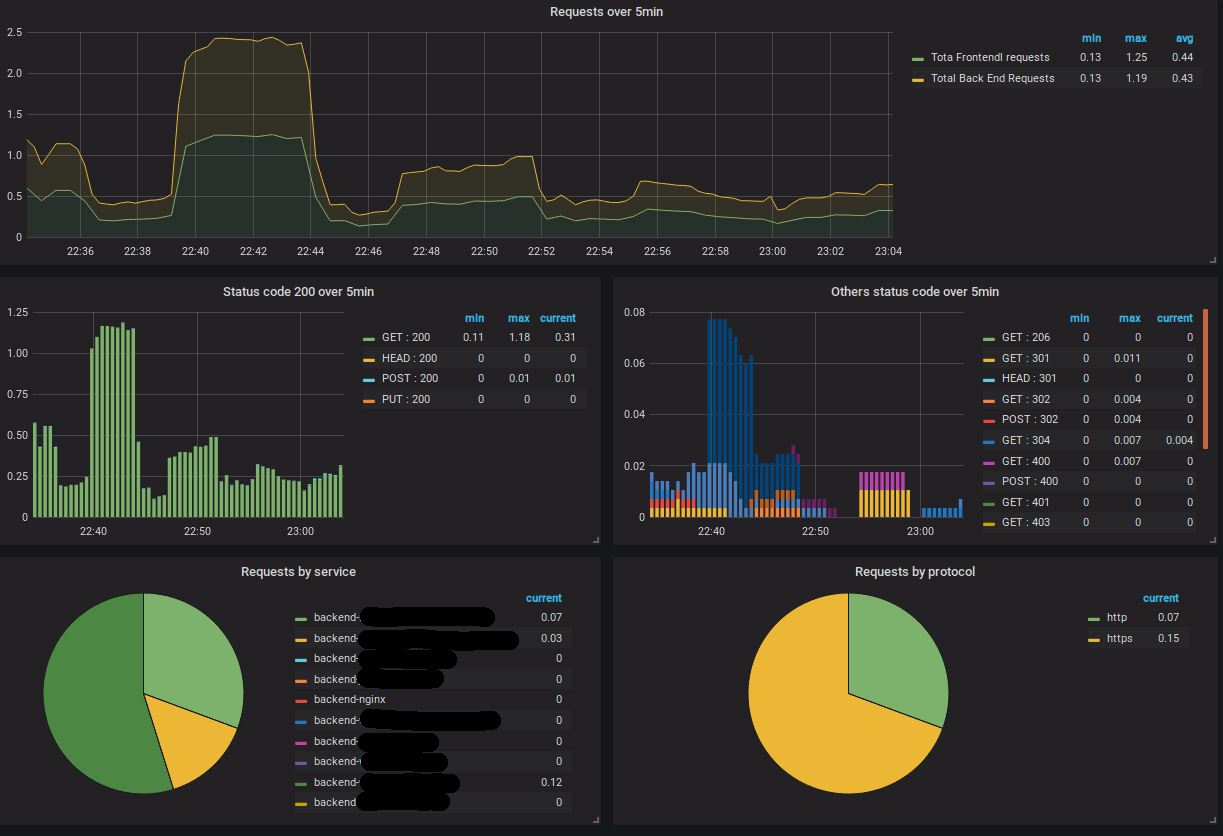
This dashboard has been updated to work with treafik 1.6+ using the --metric --metrics.prometheus metrics. The original was created by Thomas Cheronneau Dash board 4475.
Data source config
Collector type:
Collector plugins:
Collector config:
Revisions
Upload an updated version of an exported dashboard.json file from Grafana
| Revision | Description | Created | |
|---|---|---|---|
| Download |
Traefik
Easily monitor Traefik, the dynamic load balancer, with Grafana Cloud's out-of-the-box monitoring solution.
Learn more