M3DB Node Details
This dashboard visualizes much of the important information about an M3DB node's current status, health, performance, and load. It is very useful for monitoring M3DB clusters.
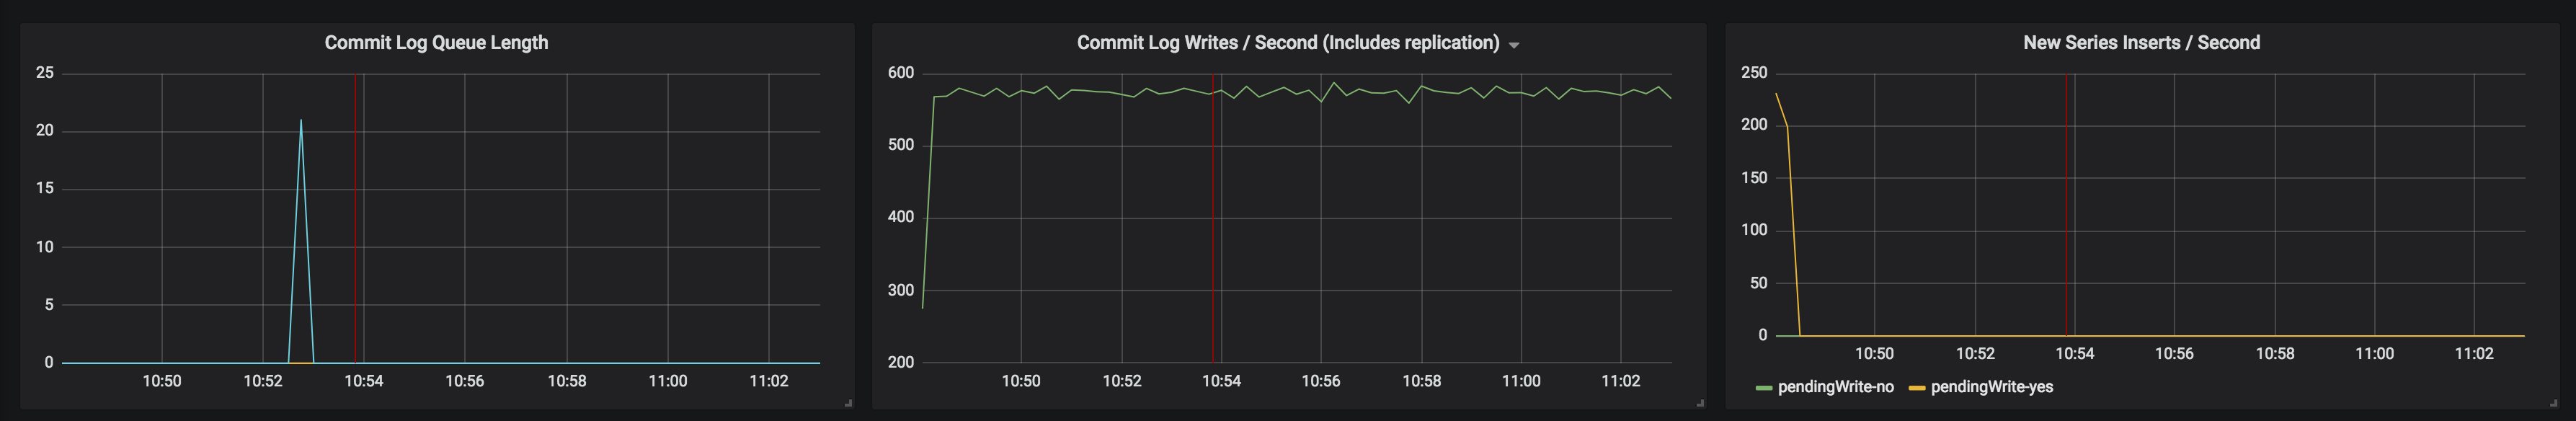
This dashboard visualizes the status, health, performance, and load of a cluster of M3DB nodes that are being scraped for metrics by a Prometheus instance. It is very useful for monitoring M3DB clusters.
Data source config
Collector type:
Collector plugins:
Collector config:
Revisions
Upload an updated version of an exported dashboard.json file from Grafana
| Revision | Description | Created | |
|---|---|---|---|
| Download |
Linux Server
Monitor Linux with Grafana. Easily monitor your Linux deployment with Grafana Cloud's out-of-the-box monitoring solution.
Learn more