Omnition Collector
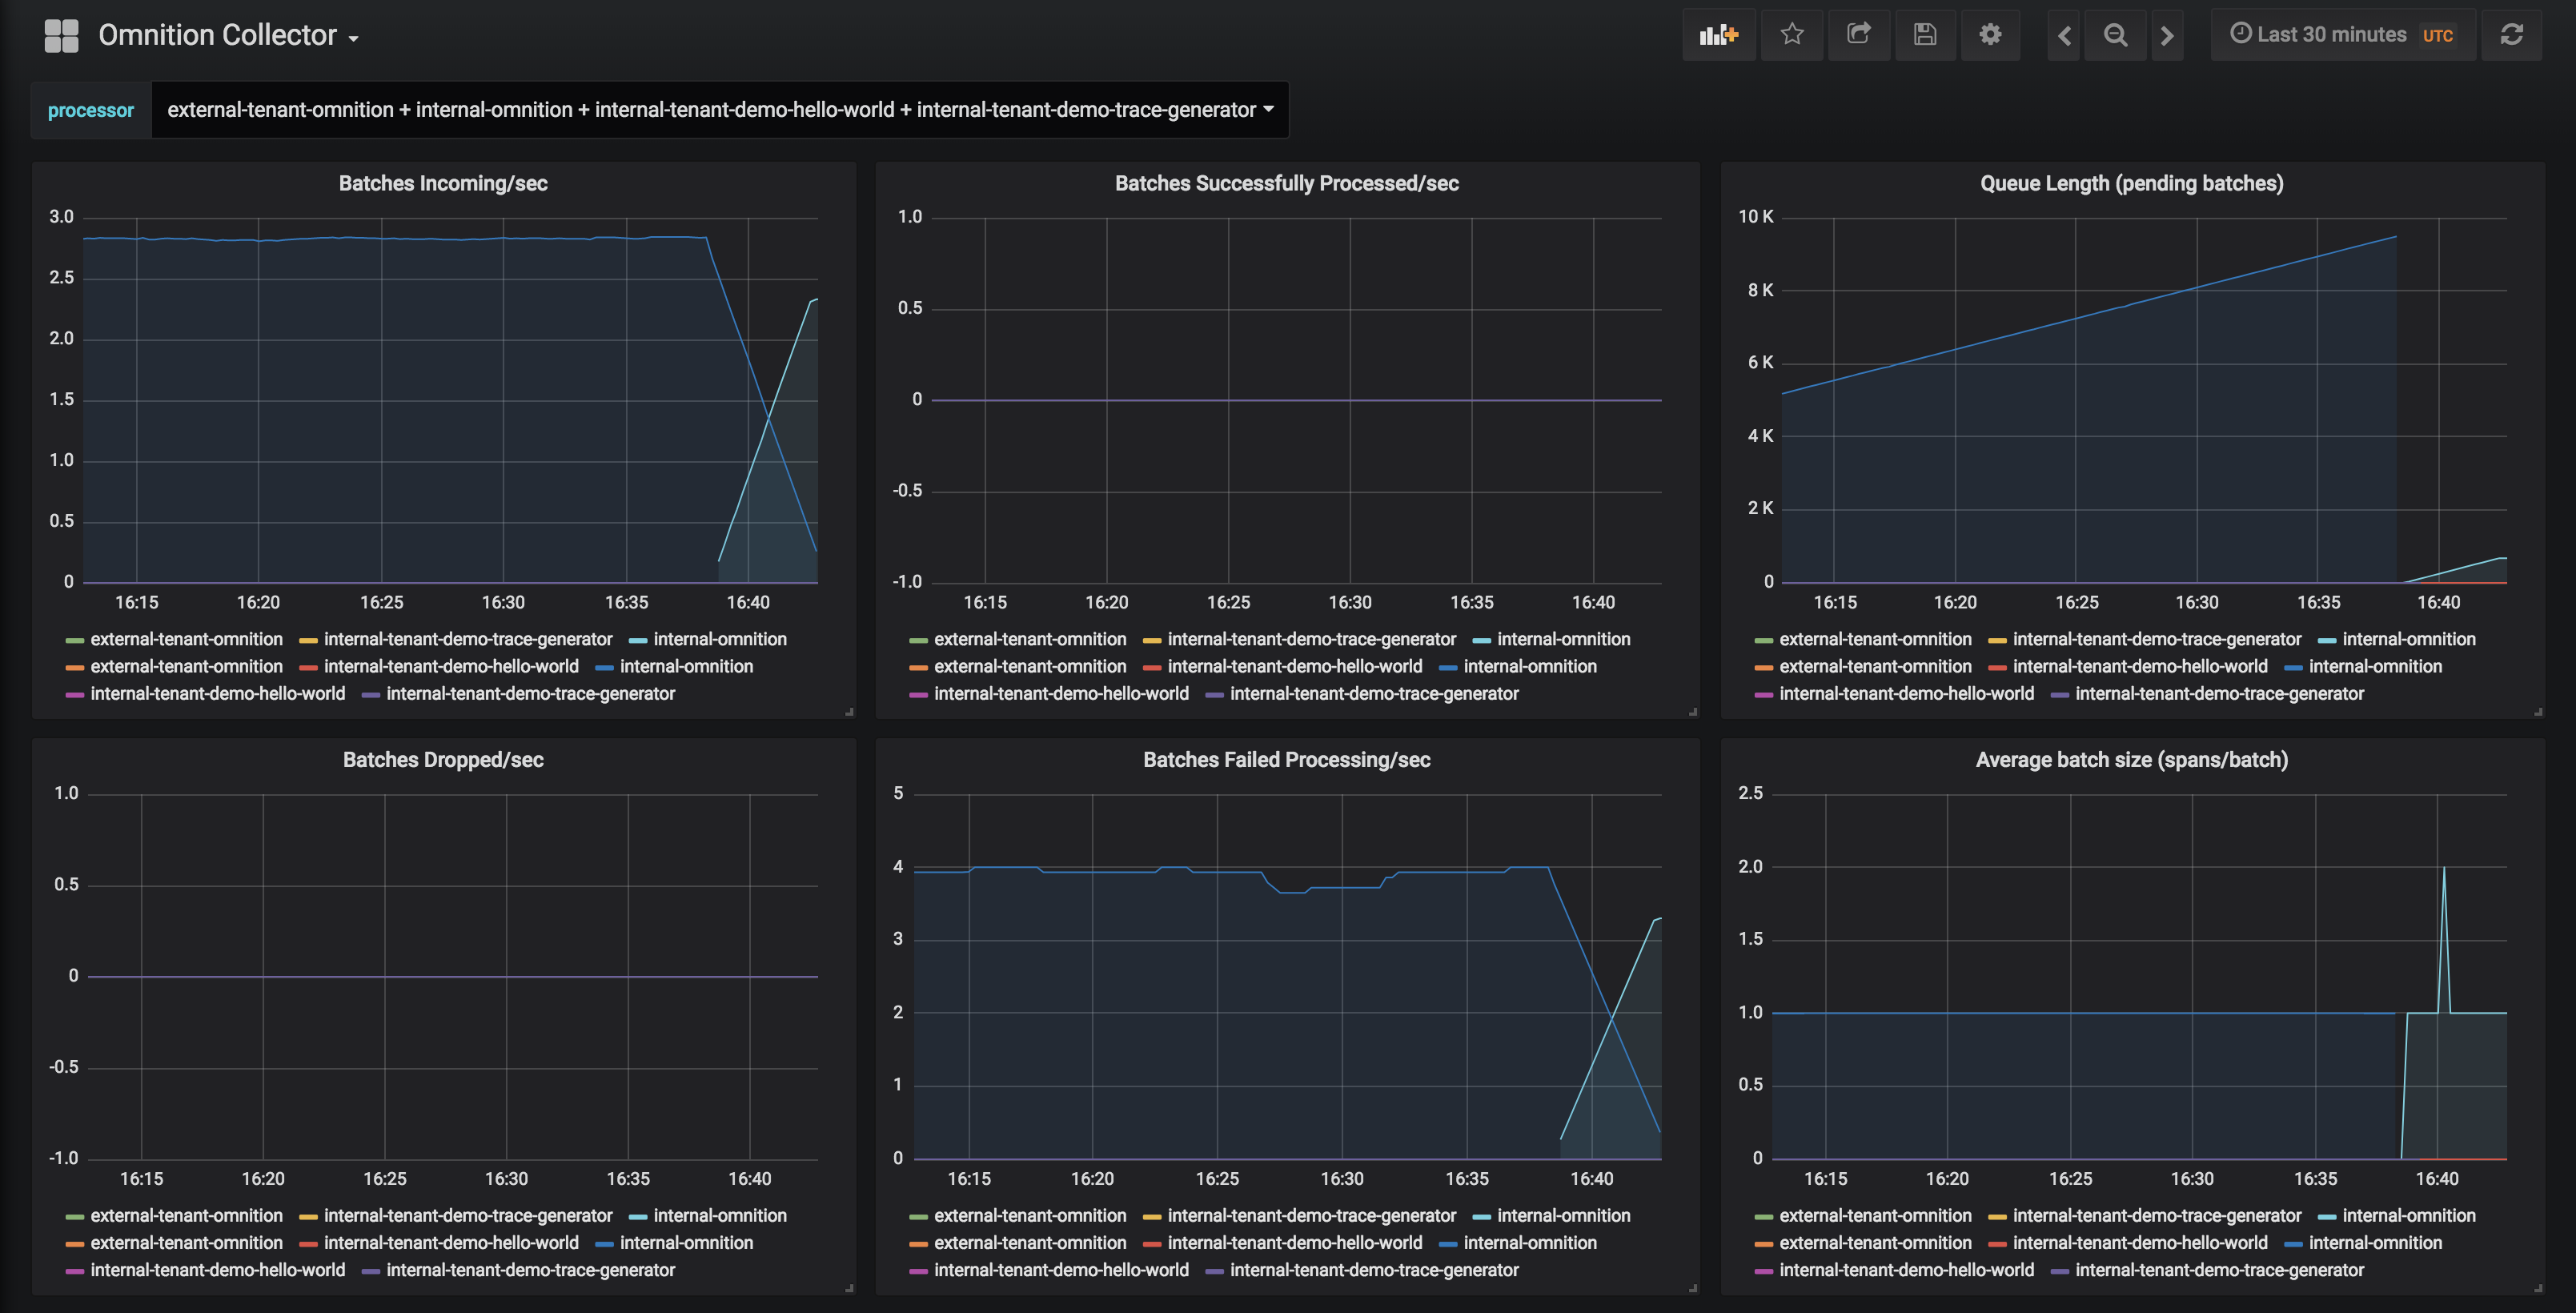
Dashboard to monitor the Omnition Collector
This is a shared dashboard to help getting started monitoring the Omnition Collector component.
The Omnition Collector is a component that receives spans from an upstream tracing component (e.g. Jaeger Agent or OpenCensus Agent) and relays those spans to downstream tracing component(s) (e.g. Jaeger collector or the Omnition Collector itself). The collector supports receiving and exporting spans in a number of protocols (e.g. Jaeger and Zipkin), multi-destination support, and per-destination in-memory buffering with retry. This component enables ingestion pipeline configurations for several use-cases. Please refer to provided documentation for more details.
This dashboard assumes prometheus data source. It was tested in a kubernetes environment, although non-k8s environments should also work (minor tweaks might be needed).
Data source config
Collector config:
Upload an updated version of an exported dashboard.json file from Grafana
| Revision | Description | Created | |
|---|---|---|---|
| Download |

