Dynamic Dashboard
InfluxDB dashboards for telegraf metrics.
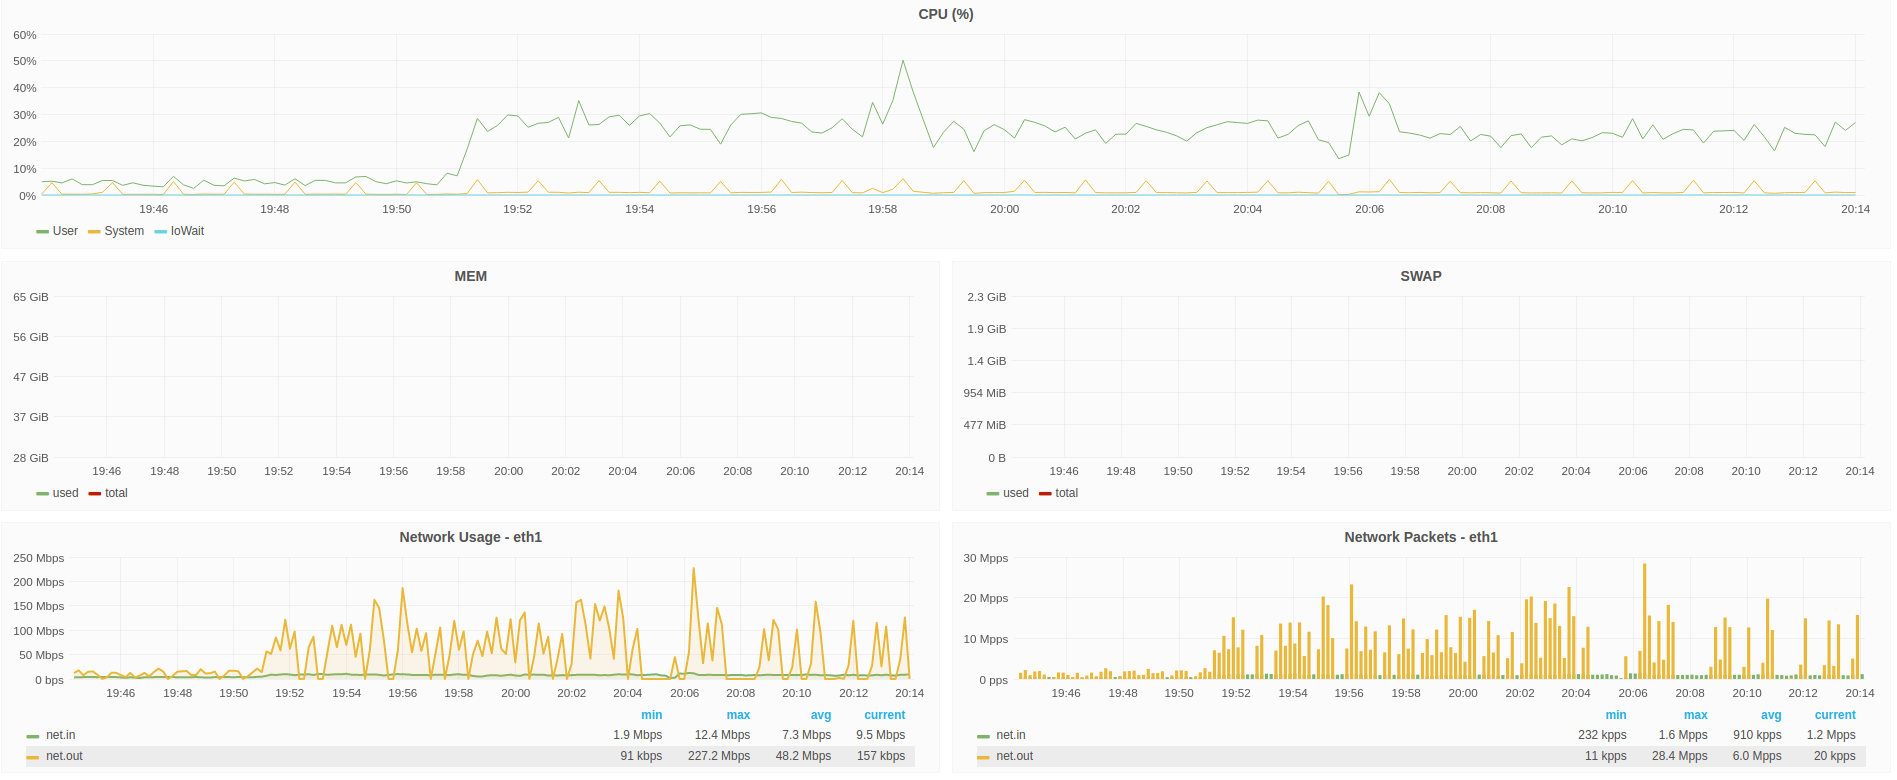
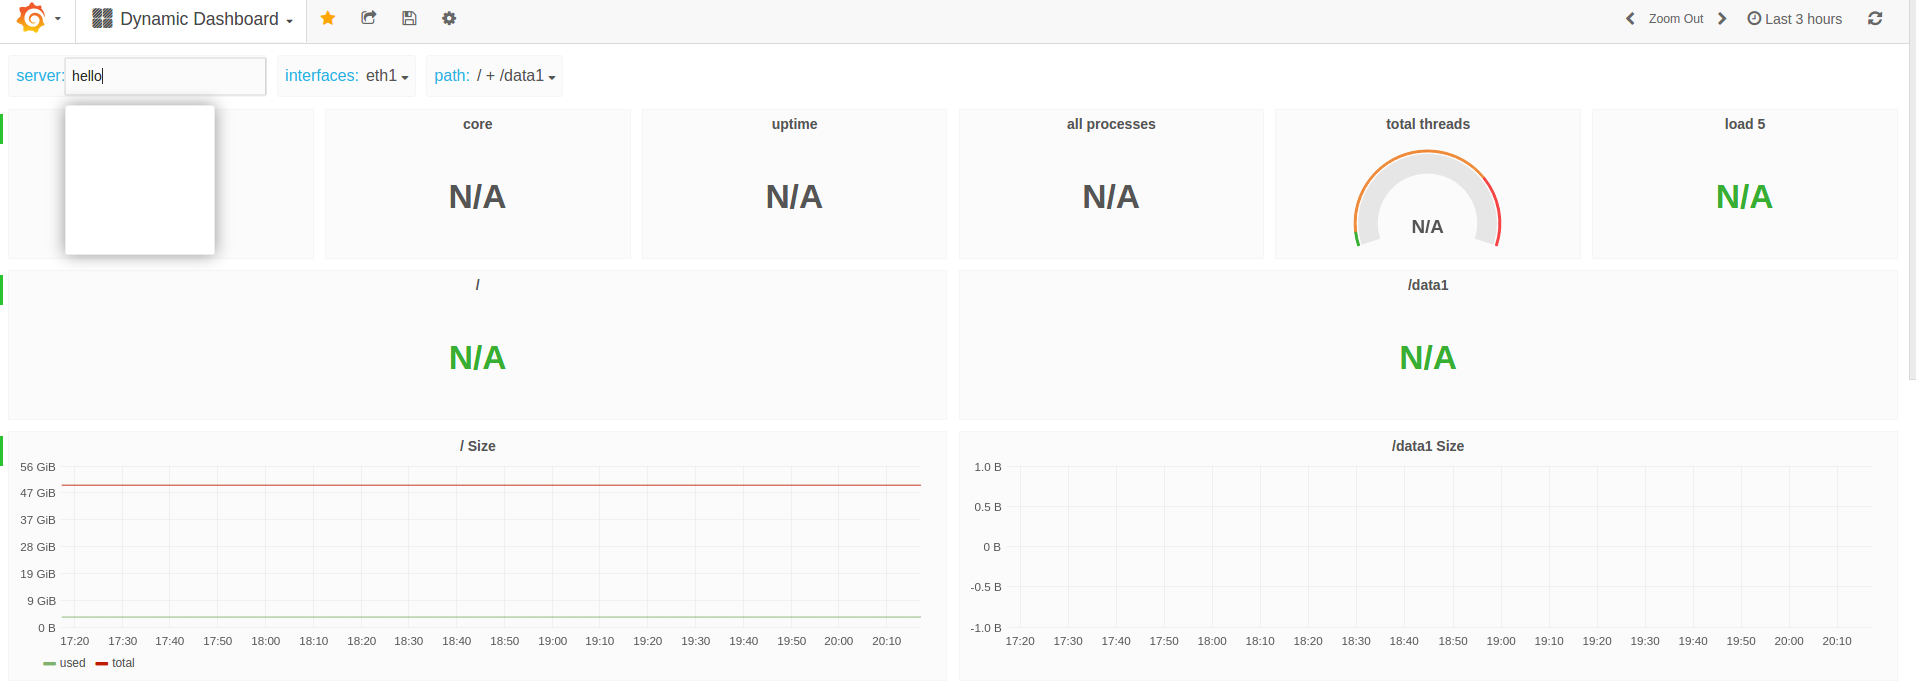
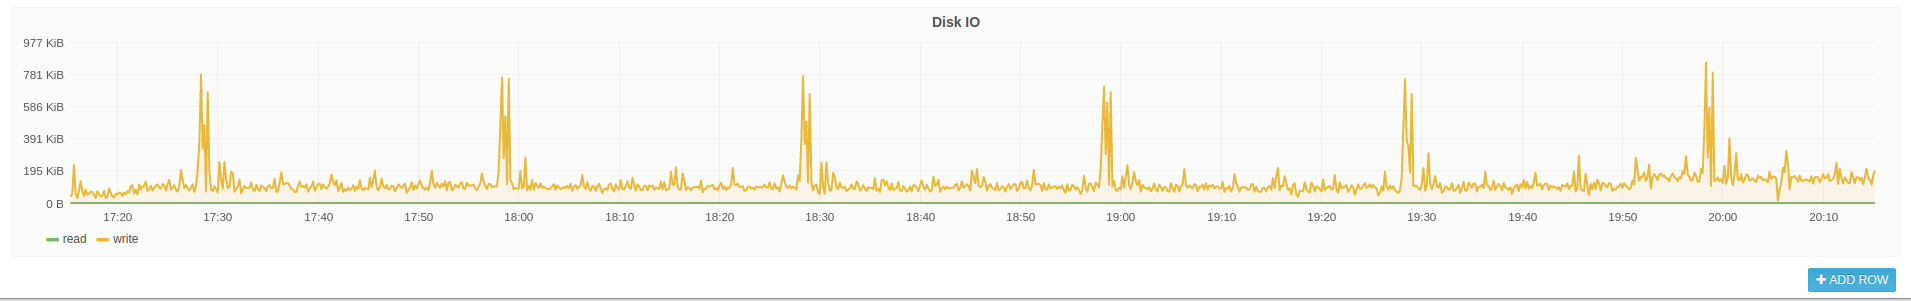
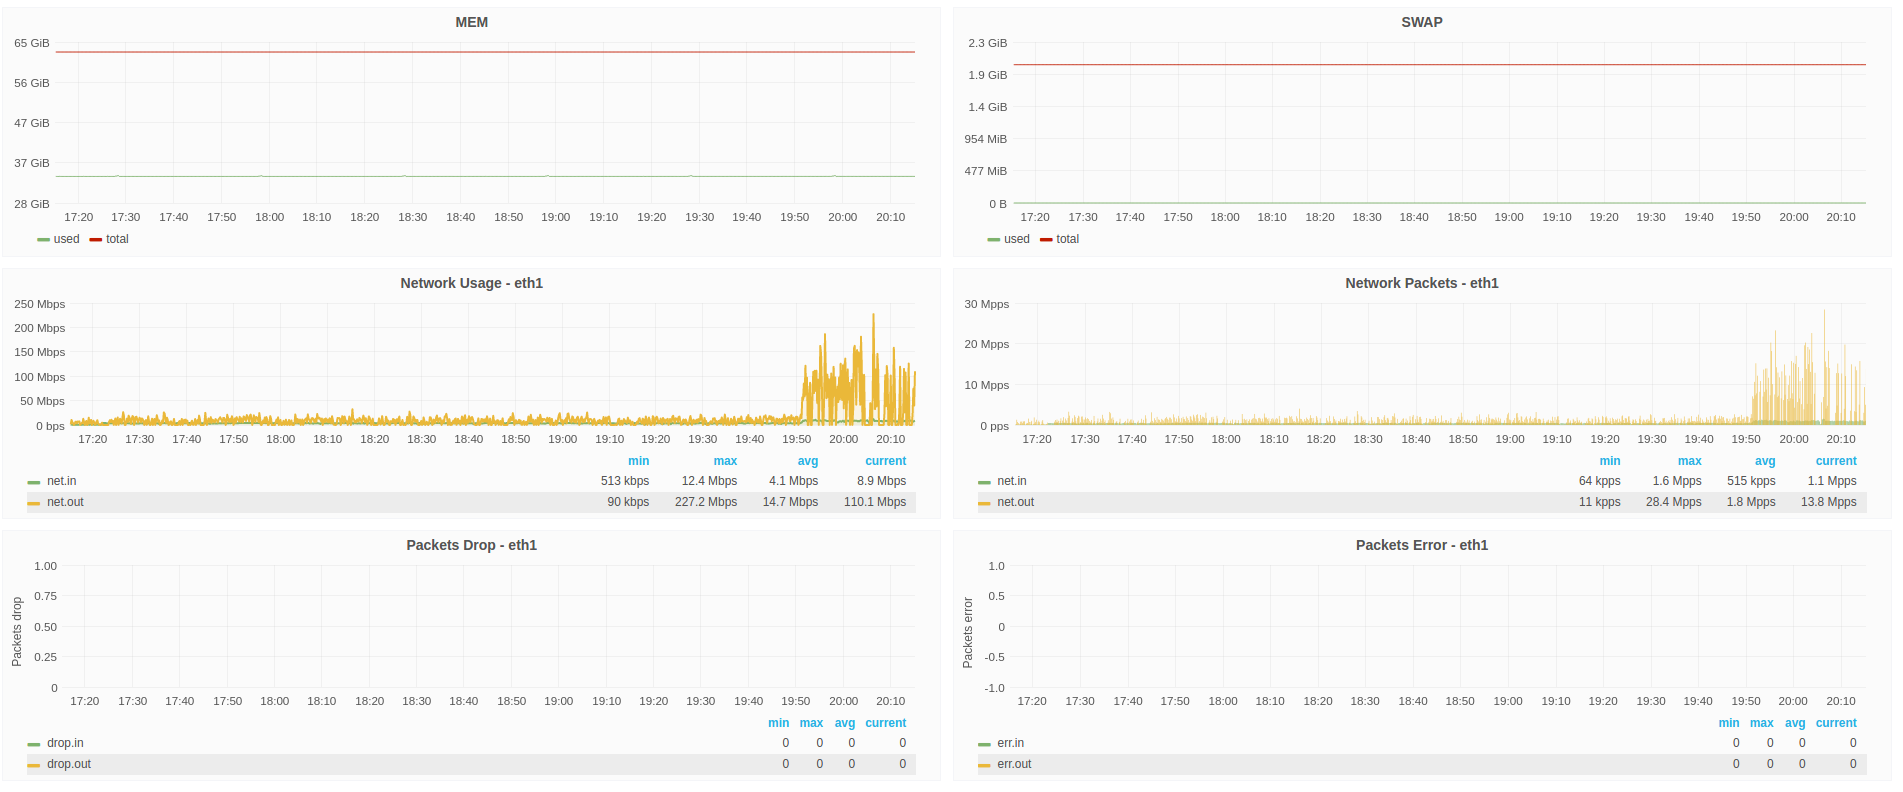
Dynamic dashboard for Host metrics from Telegraf:
- cpu
- disk
- disk.io
- processes
- swap memory usage
- memory usage
- system load and uptime
- network interface usage
- inodes usage
Make it better :
For feedback and ideas to improve this dashboard please open an issue here: https://github.com/lbtm/grafana_dashboard/issues
Data source config
Collector type:
Collector plugins:
Collector config:
Revisions
Upload an updated version of an exported dashboard.json file from Grafana
| Revision | Description | Created | |
|---|---|---|---|
| Download |