Apache Spark - Performance Metrics
Monitors spark metrics using Prometheus in Kubernetes
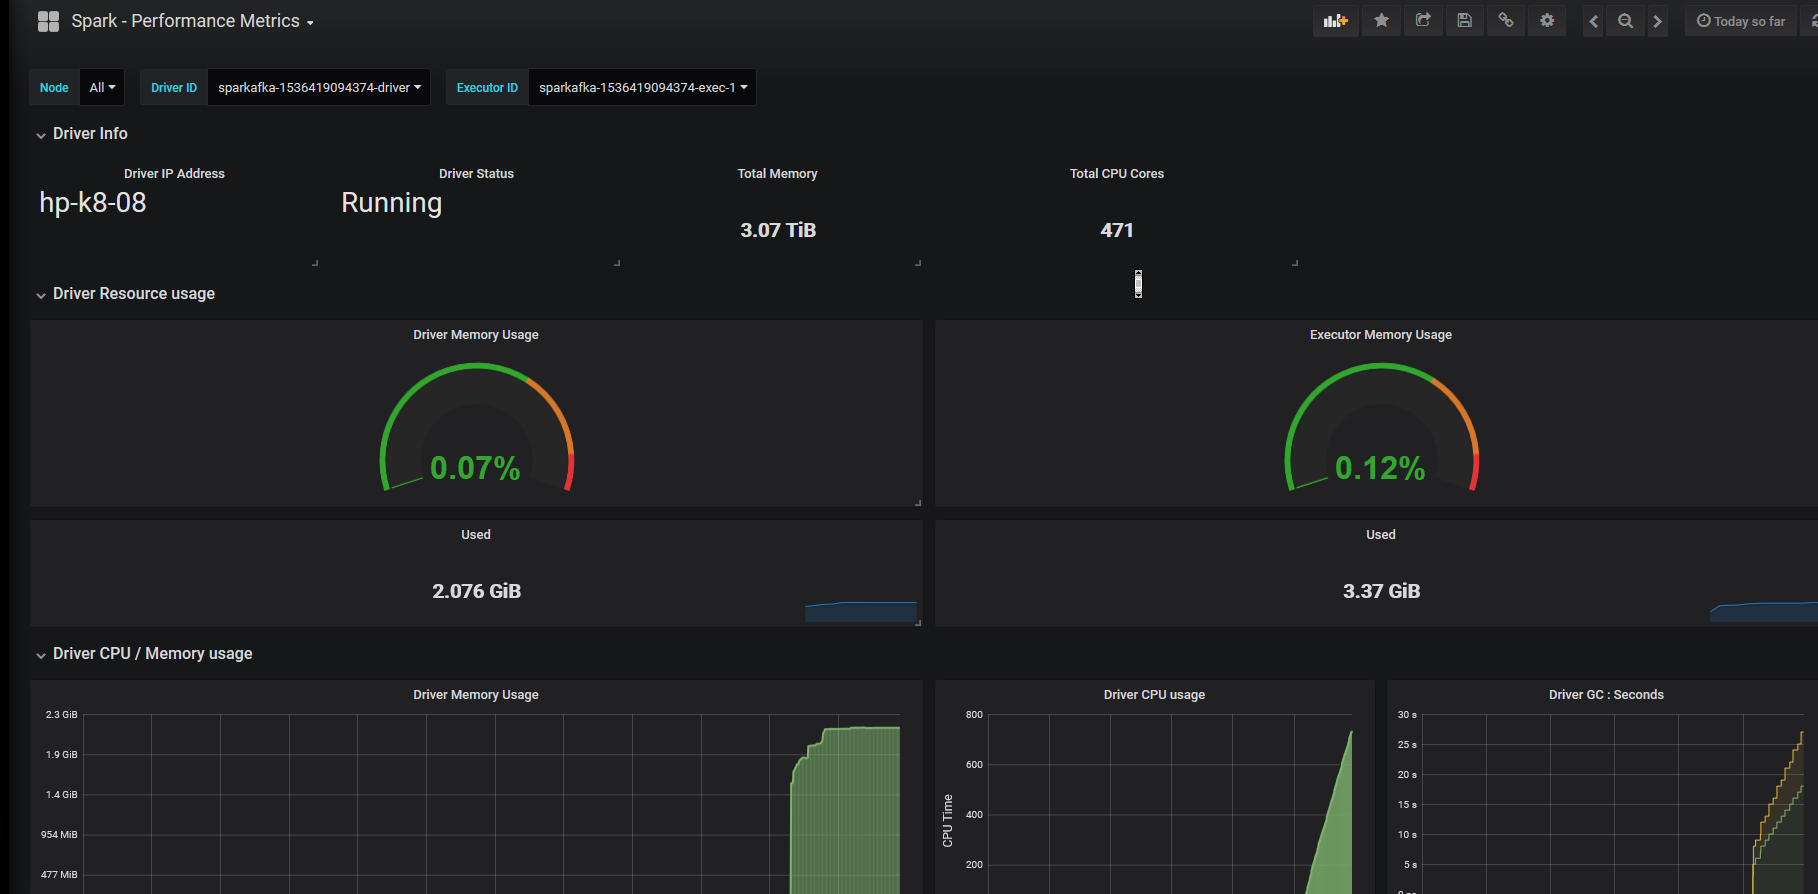
Spark Metrics Dashboard :- Having Spark Driver / Executor Memory Consumption and other related metrics in Kubernetes using JMX Exporter and Prometheus Service Discovery Including Network I/O and Disk Read/Write Metrics for Spark Driver , Executors and Shuffle Service
Add Labels to Spark Driver and Executor accordingly for Prometheus to fetch metrics through service discovery
Data source config
Collector type:
Collector plugins:
Collector config:
Revisions
Upload an updated version of an exported dashboard.json file from Grafana
| Revision | Description | Created | |
|---|---|---|---|
| Download |
Apache Spark
Easily monitor Apache Spark, a unified analytics engine for large-scale data processing, with Grafana Cloud's out-of-the-box monitoring solution.
Learn more