Kubernetes cluster monitoring (Prometheus)
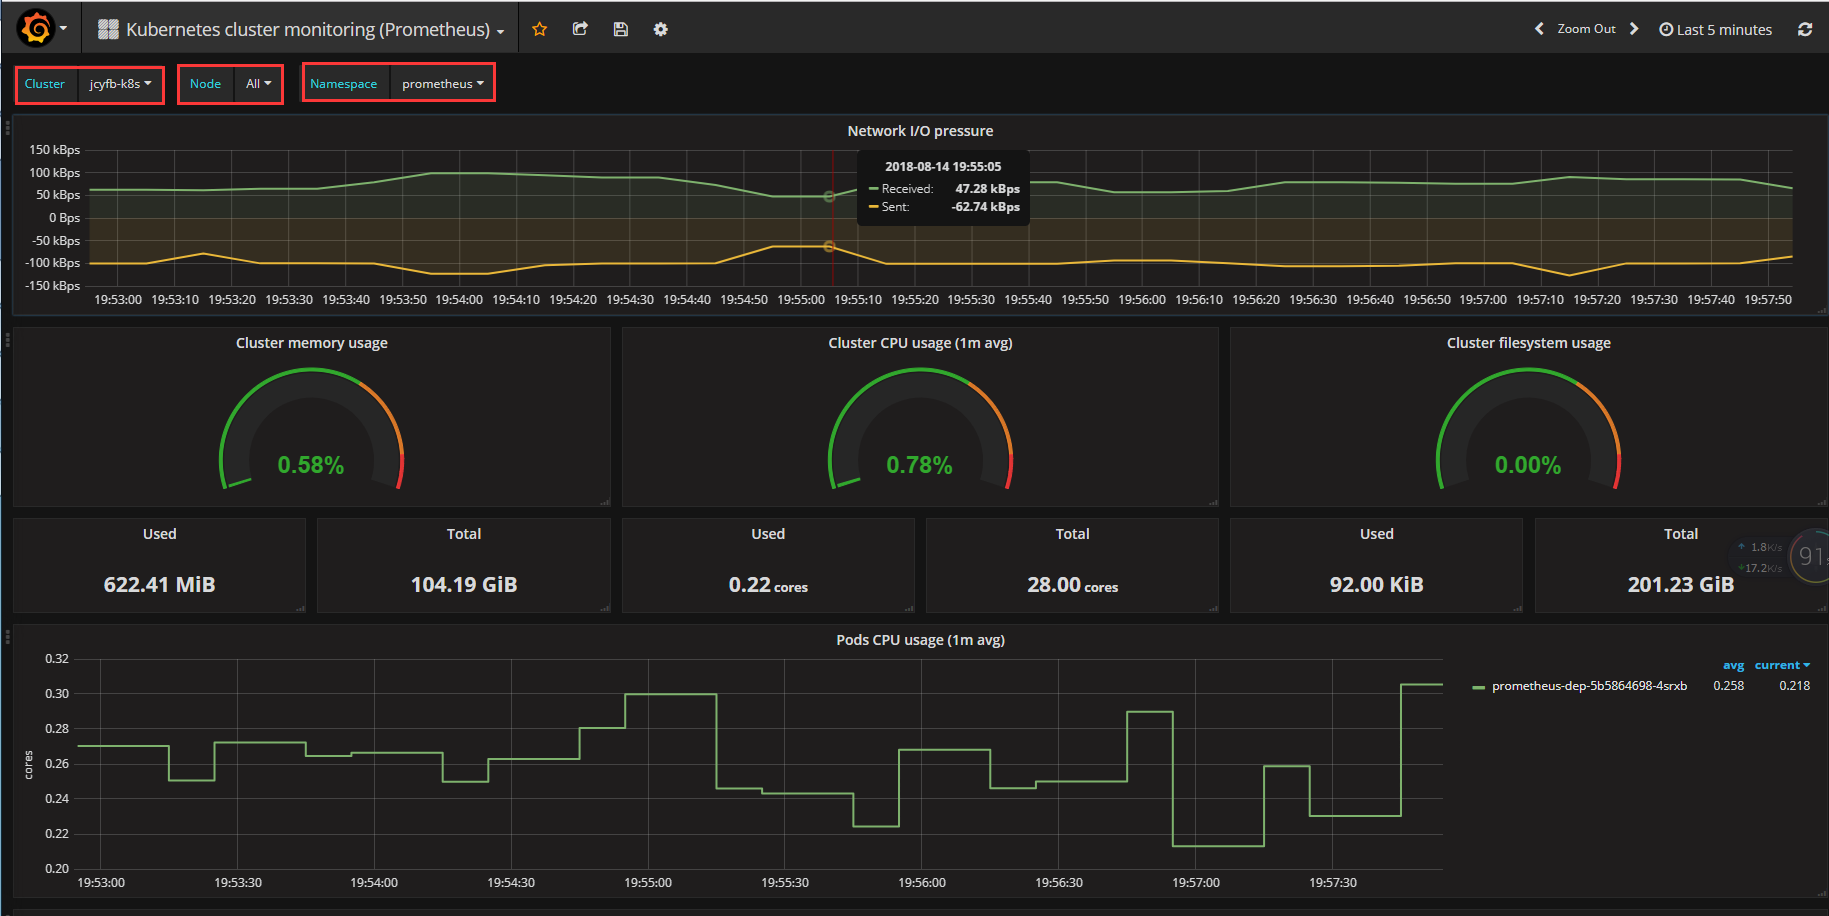
Monitors Kubernetes cluster using Prometheus. Shows overall cluster CPU / Memory / Filesystem usage as well as individual pod, containers, systemd services statistics. Uses cAdvisor metrics only.
首先,这是一个kubernetes非常全面的监控面板;其次增加了几个选项:"Cluster"、“Node”、"Namespace",并且 Node 和 Namespace 会随Cluster联动。
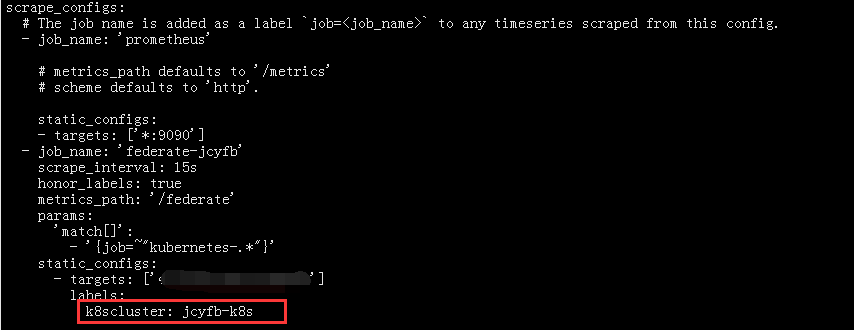
注意:Cluster名称是在prometheus配置文件里面自定义的标签k8scluster,比如 k8scluster: jcyfb-k8s。请看第二张图片
static_configs: - targets: ['x.x.x.x:9090'] labels: k8scluster: jcyfb-k8s
Data source config
Collector config:
Upload an updated version of an exported dashboard.json file from Grafana
| Revision | Description | Created | |
|---|---|---|---|
| Download |
Kubernetes
Monitor your Kubernetes deployment with prebuilt visualizations that allow you to drill down from a high-level cluster overview to pod-specific details in minutes.
Learn more

