HTTP logs
HTTP logs dashboard from Elastic Stack.
Simple HTTP logs dashboard using Elastic Stack.
Dashboard metrics
GRAPH
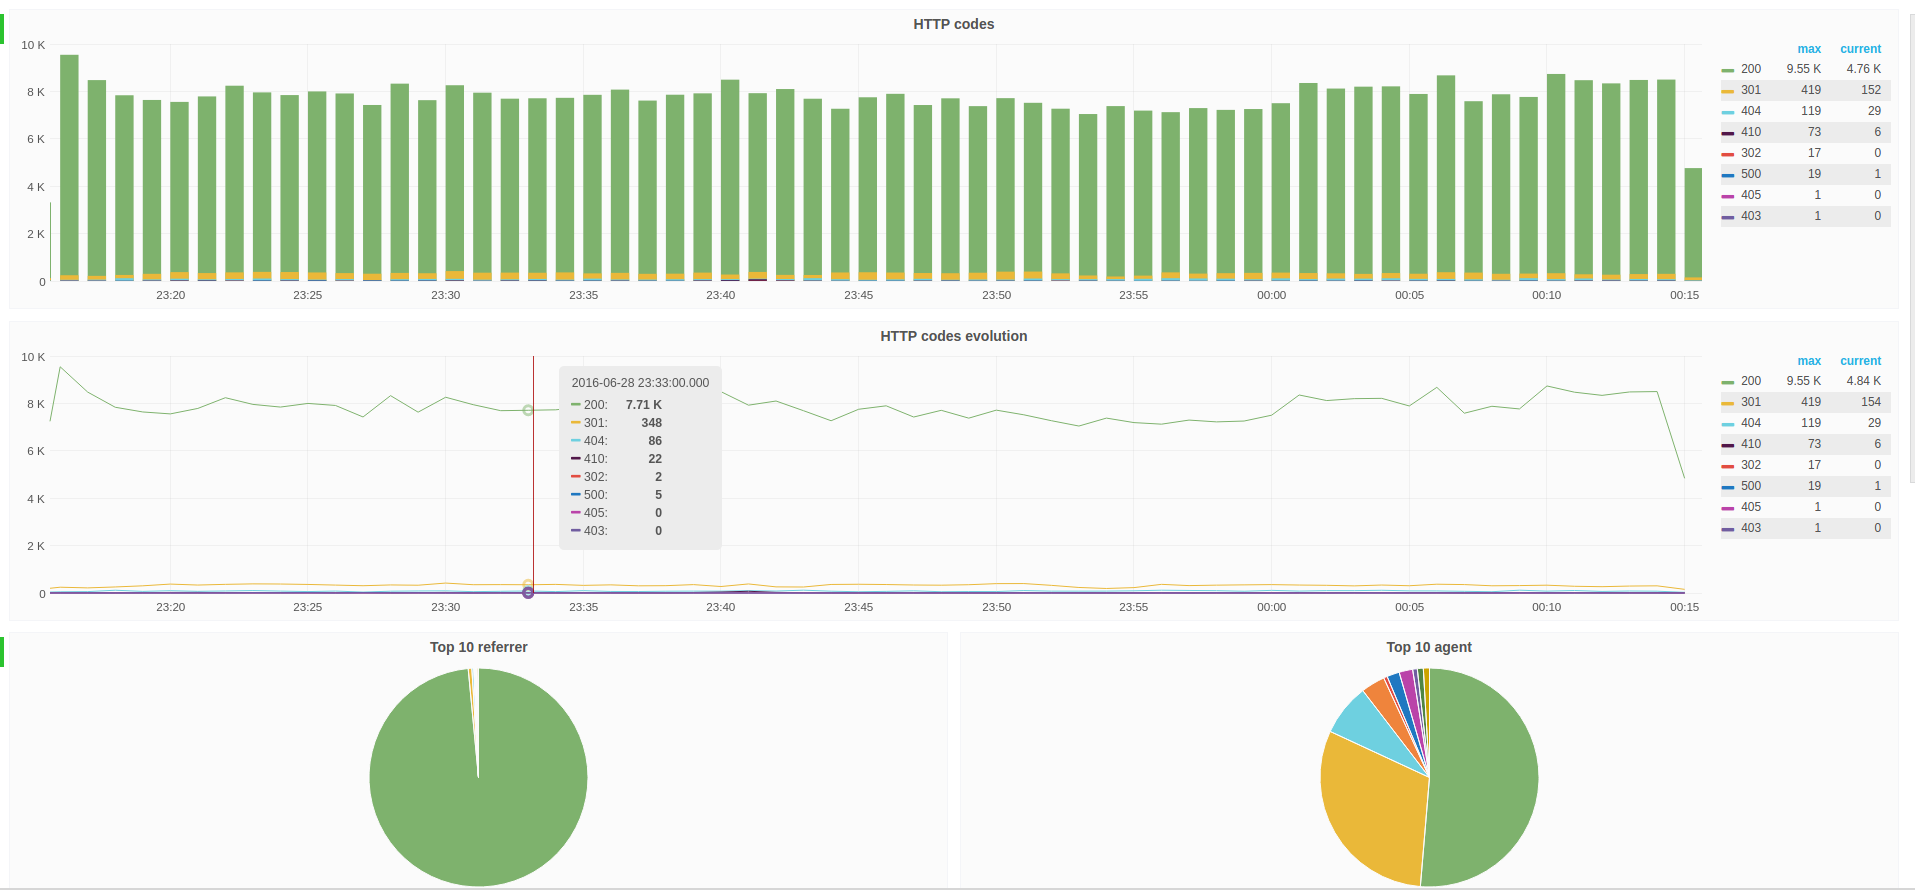
- HTTP codes
- HTTP codes evolution
PIE CHART
- Top 10 agent
- Top 10 referrer
- Top 10 client IP
- Top 10 request
Make it better :
For feedback and ideas to improve this dashboard please open an issue here: https://github.com/lbtm/grafana_dashboard/issues
Data source config
Collector type:
Collector plugins:
Collector config:
Revisions
Upload an updated version of an exported dashboard.json file from Grafana
| Revision | Description | Created | |
|---|---|---|---|
| Download |
Apache HTTP Server
Easily monitor Apache HTTP Server, an open source HTTP server for modern operating systems including UNIX and Windows, with Grafana Cloud's out-of-the-box monitoring solution.
Learn more