Elasticsearch
Dashboard to view metrics of elasticsearch_exporter on each elasticsearch servers
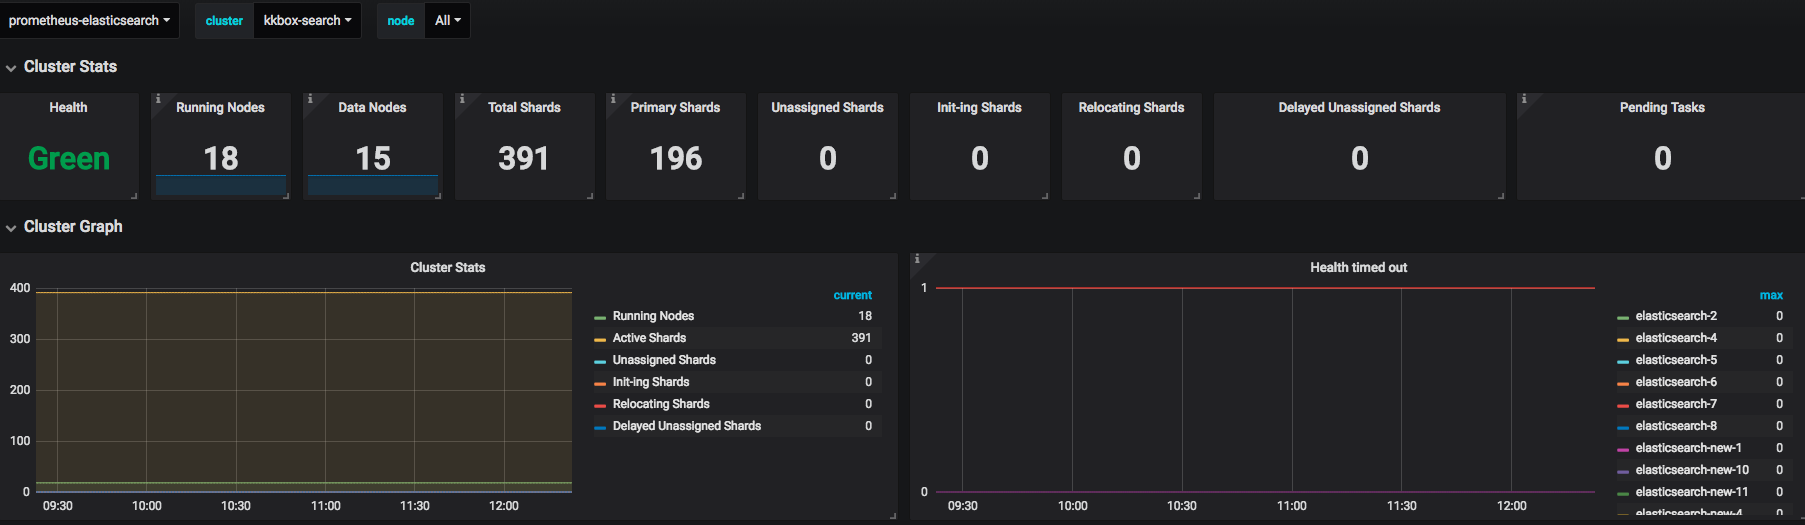
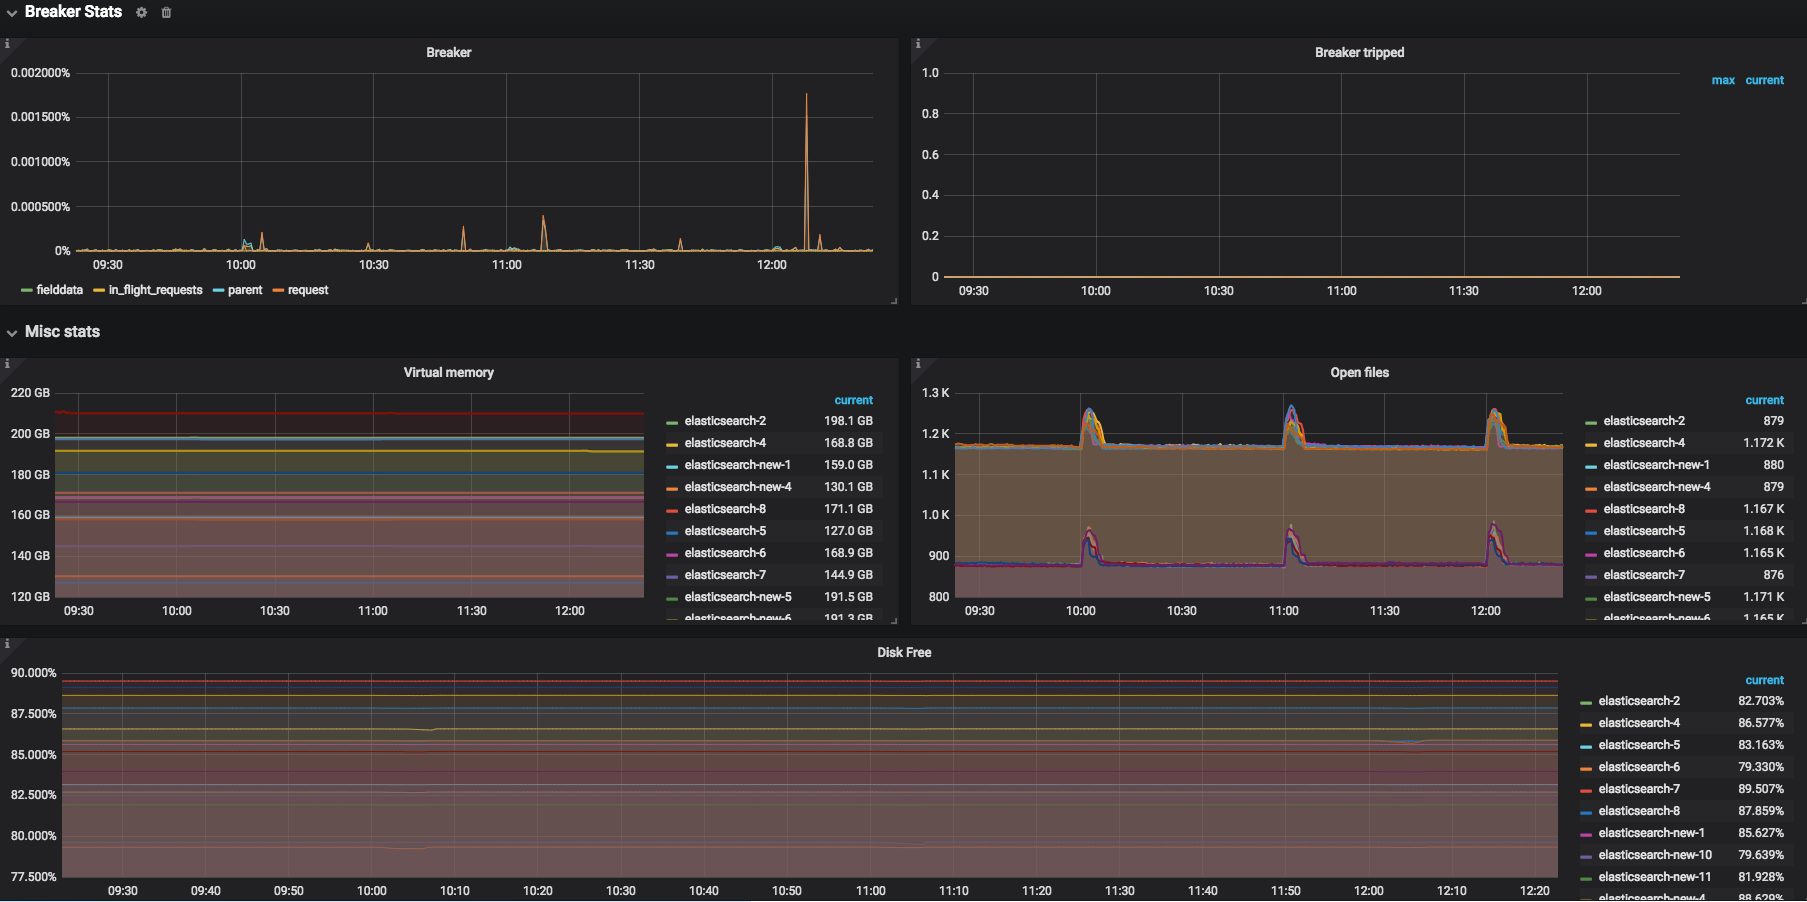
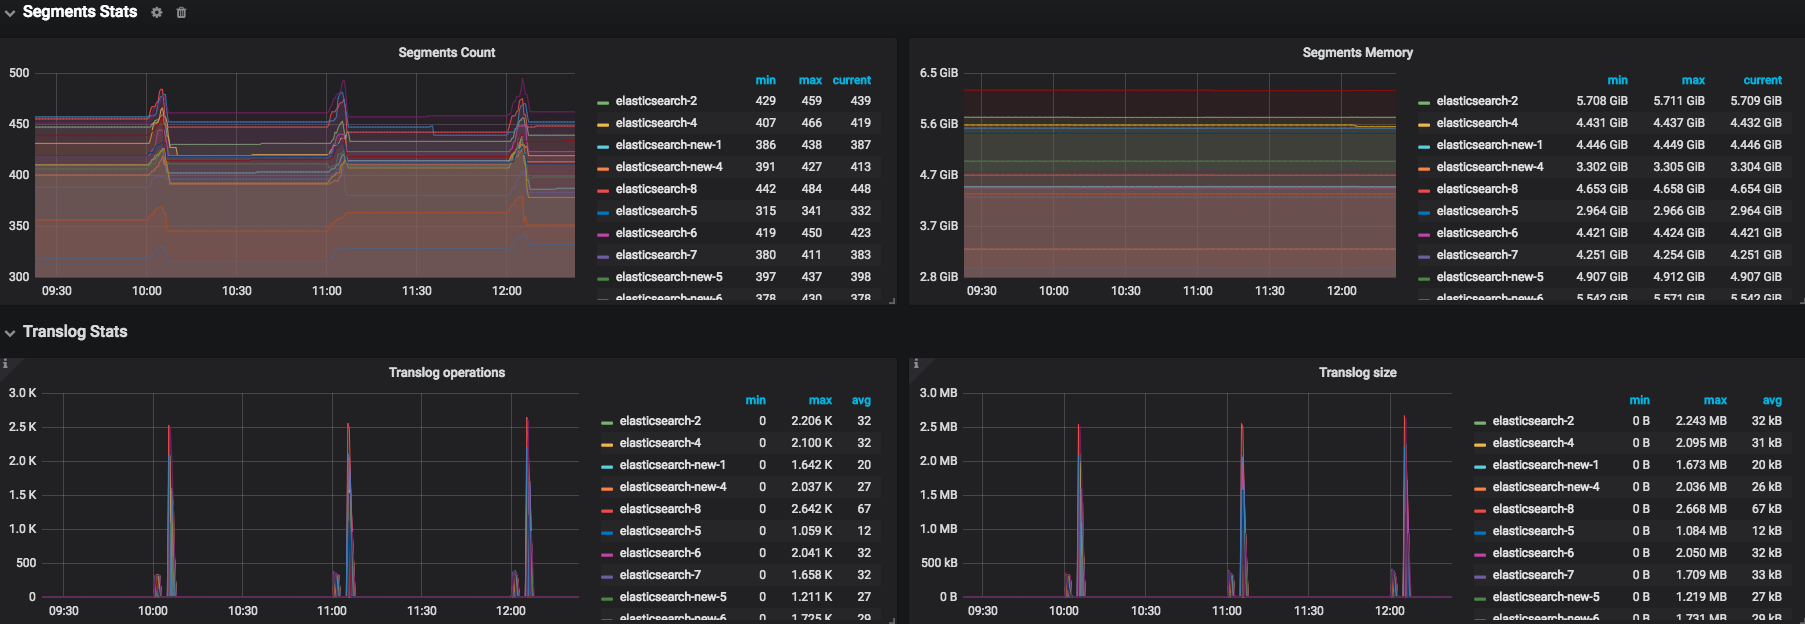
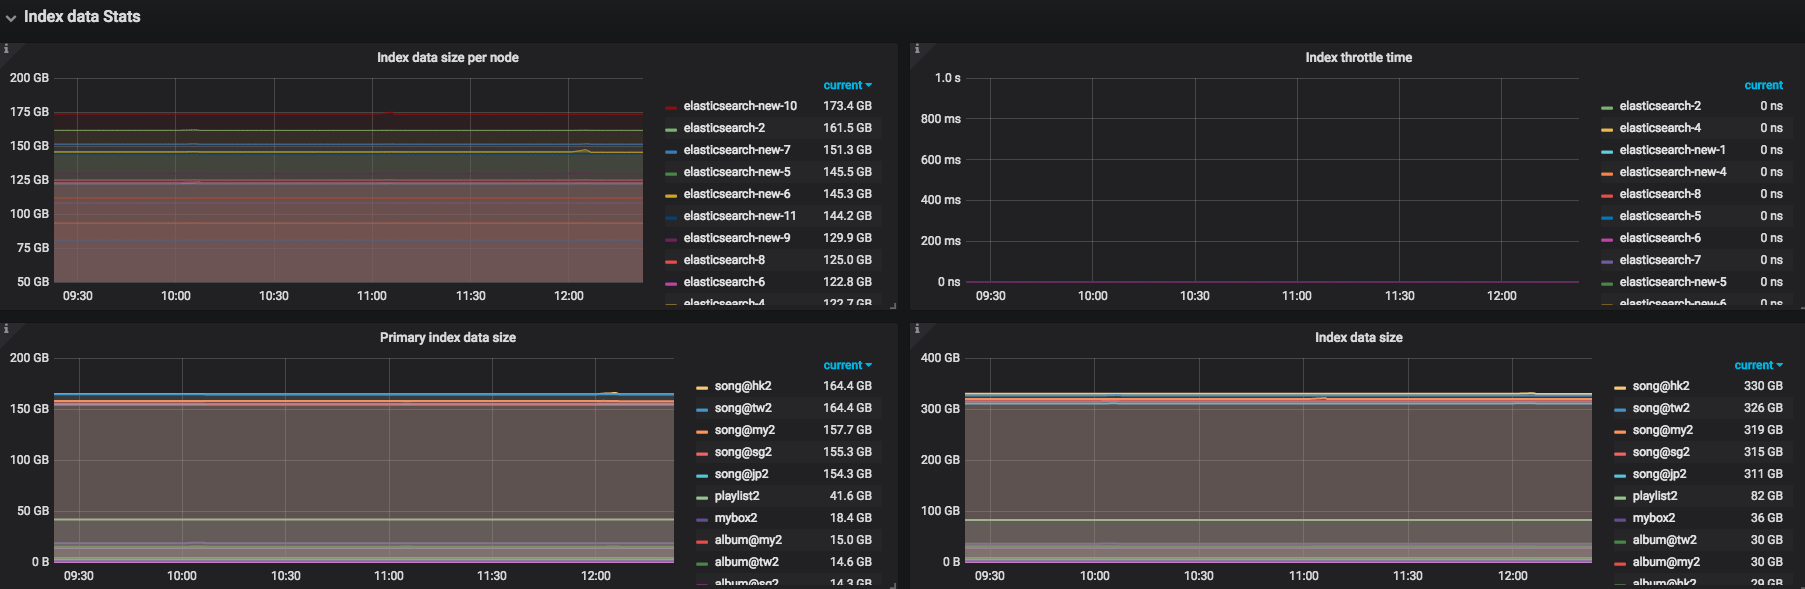
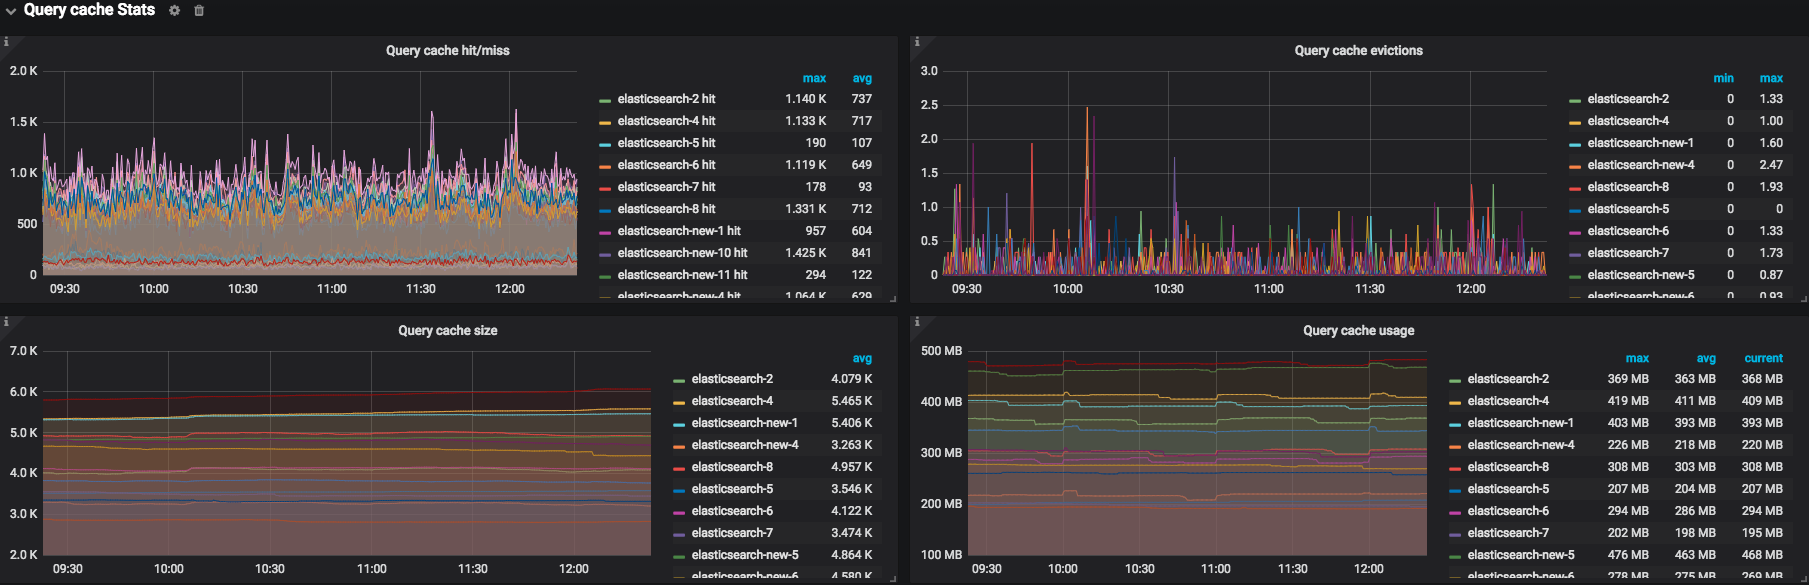
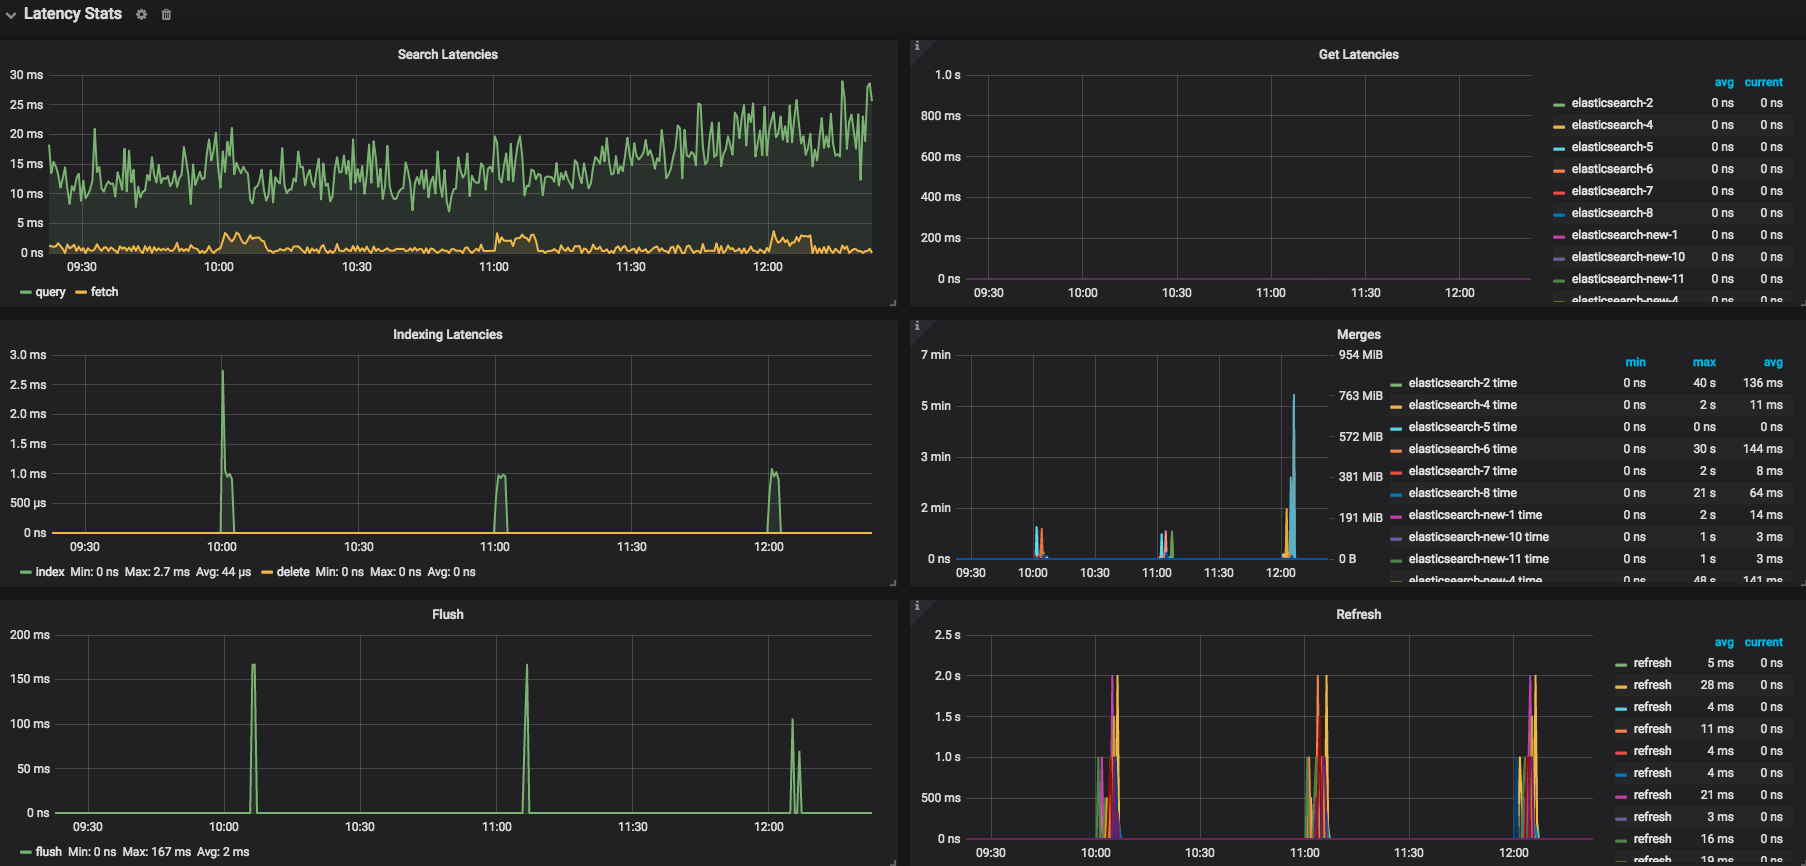
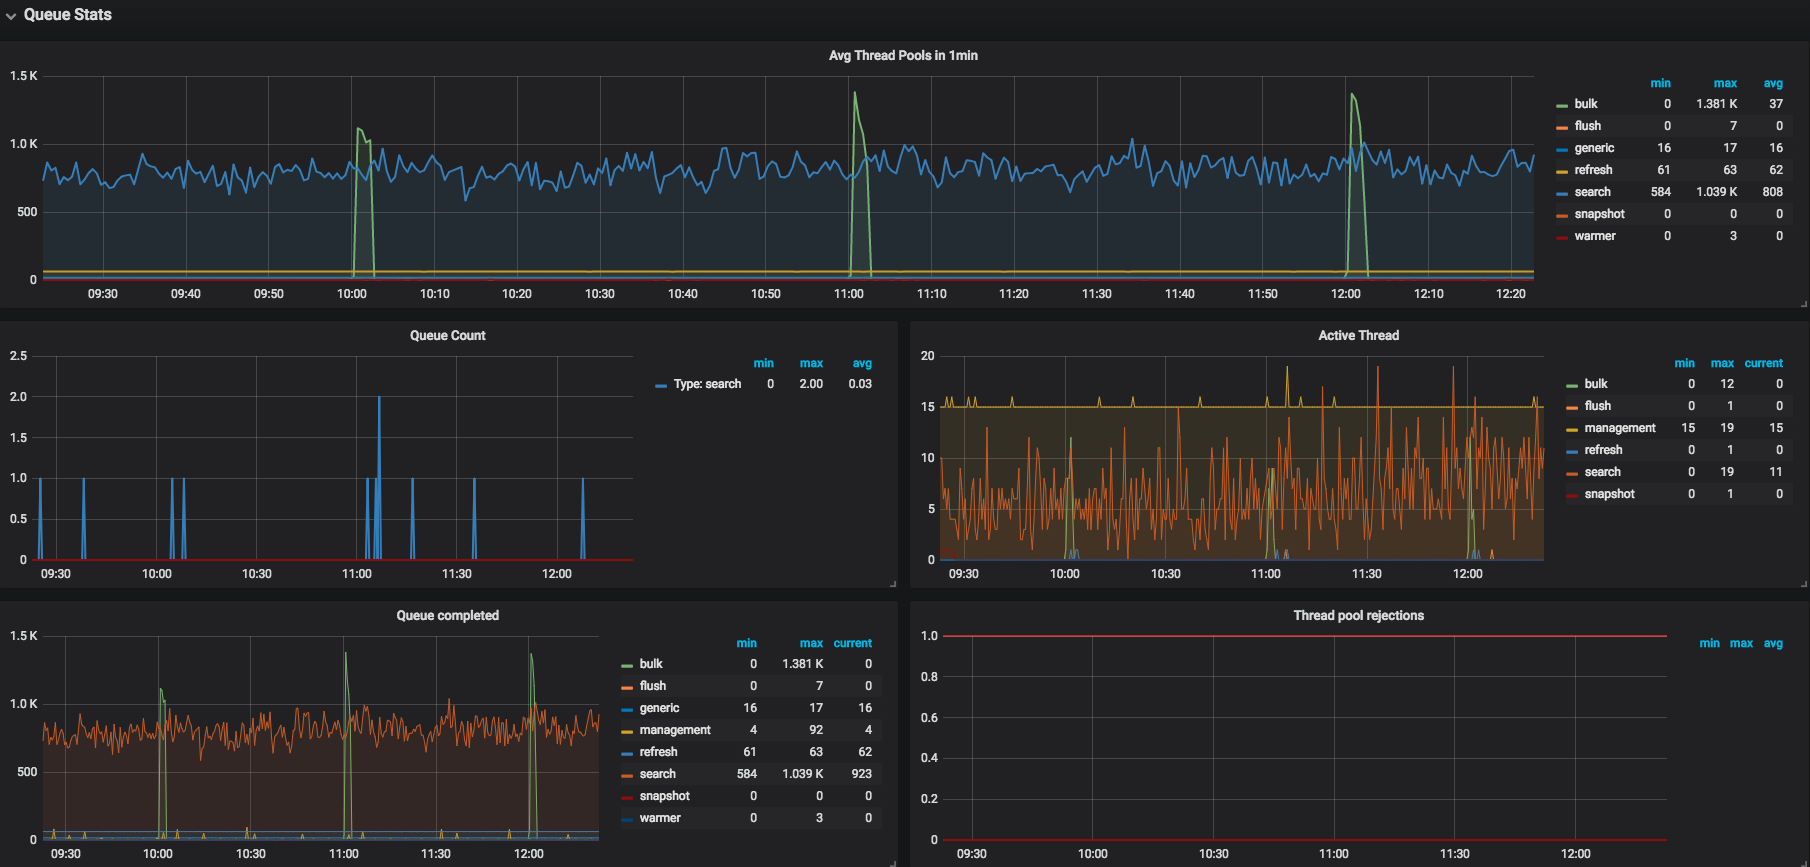
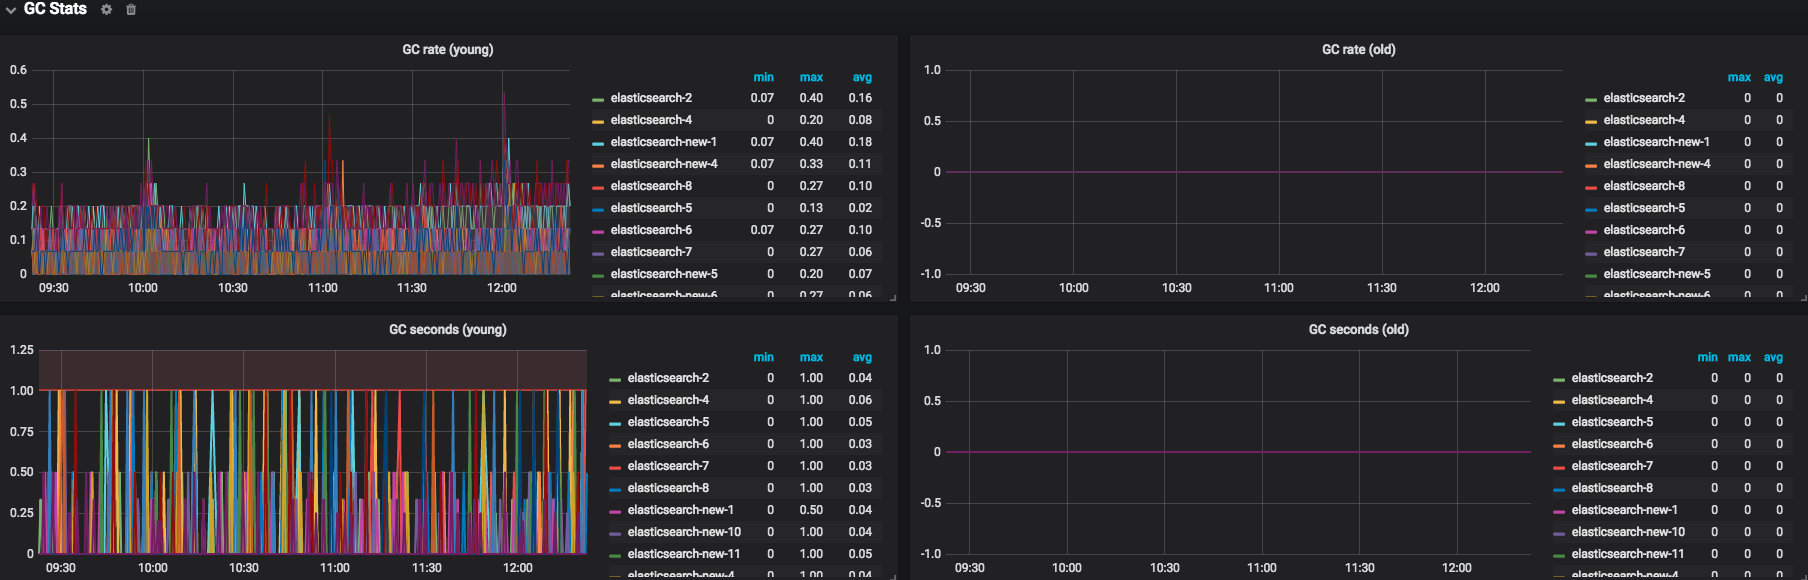
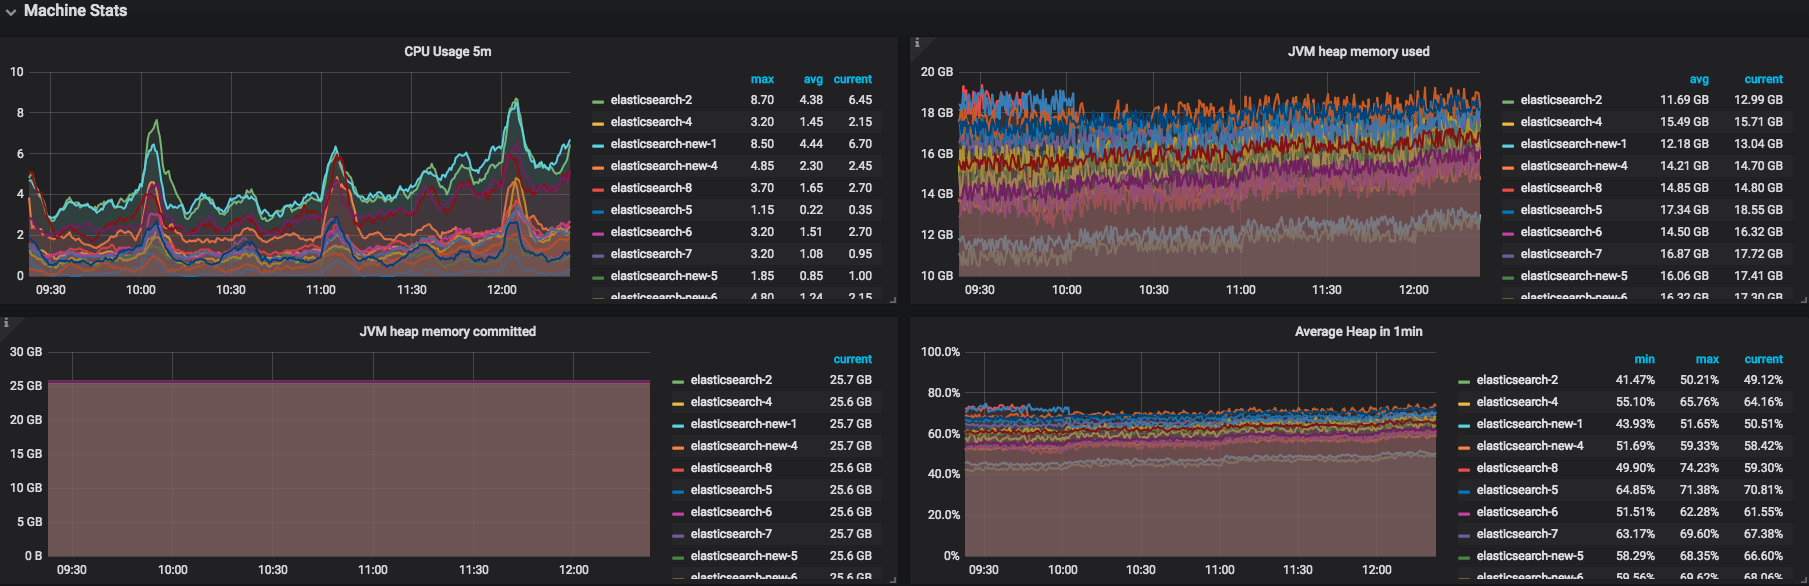
This dashboard requires and work perfectly with elasticsearch_exporter, It provides complete charts for all of the metrics, grouping related charts together by row and arranges charts based on their importance.
Data source config
Collector type:
Collector plugins:
Collector config:
Revisions
Upload an updated version of an exported dashboard.json file from Grafana
| Revision | Description | Created | |
|---|---|---|---|
| Download |
Elasticsearch
Easily monitor Elasticsearch, a distributed, multitenant full-text search engine, with Grafana Cloud's out-of-the-box monitoring solution.
Learn more