ps-monitoring
From the Pluralsight training course: Monitoring Containerized Application Health with Docker
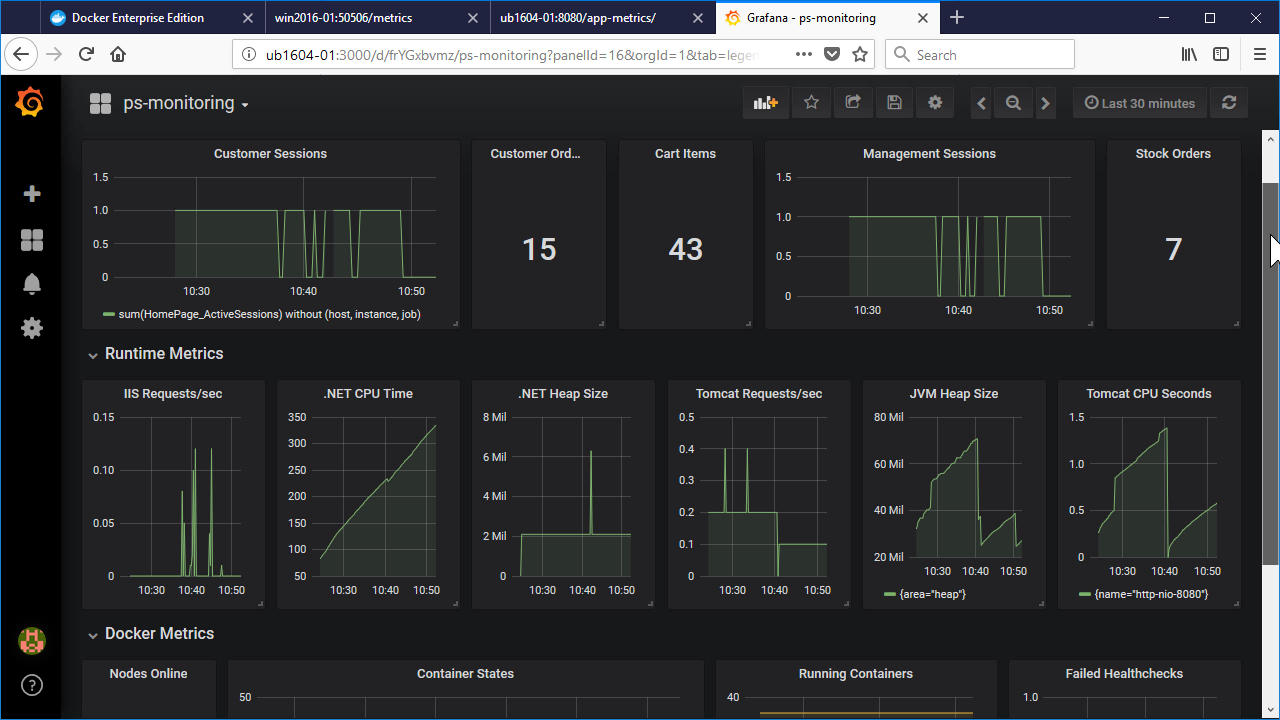
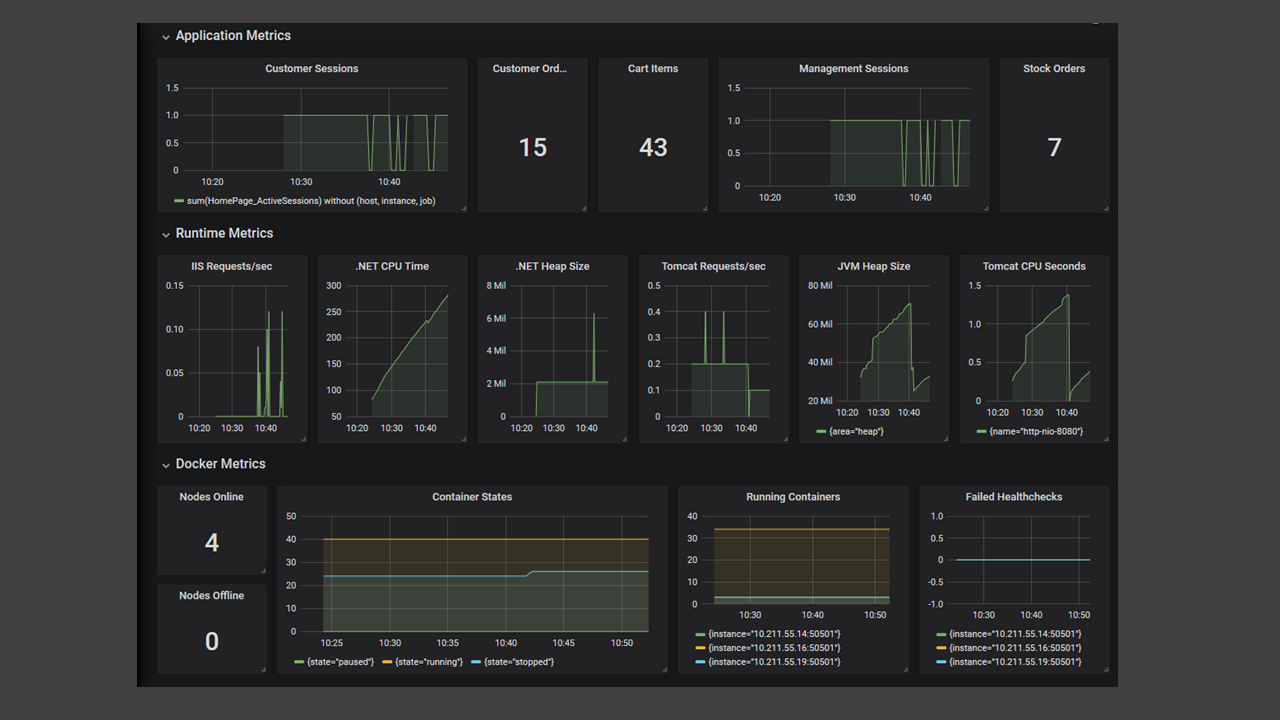
Sample dashboard used in the Pluralsight training course: Monitoring Containerized Application Health with Docker.
The course demonstrates a monitoring architecture using Prometheus & Grafana running in containers on a hybrid Docker Swarm cluster - with a mixture of Linux and Windows nodes.
The dashboard shows metrics from a .NET application running in Windows containers and a Java application running in Linux containers. Panels group different metrics sources: application, runtime (Tomcat & IIS), Docker platform.
Data source config
Collector config:
Upload an updated version of an exported dashboard.json file from Grafana
| Revision | Description | Created | |
|---|---|---|---|
| Download |


