Ceph Clusters Overview Prometheus
Dashboard for monitoring ceph cluster stats using native ceph prometheus module.
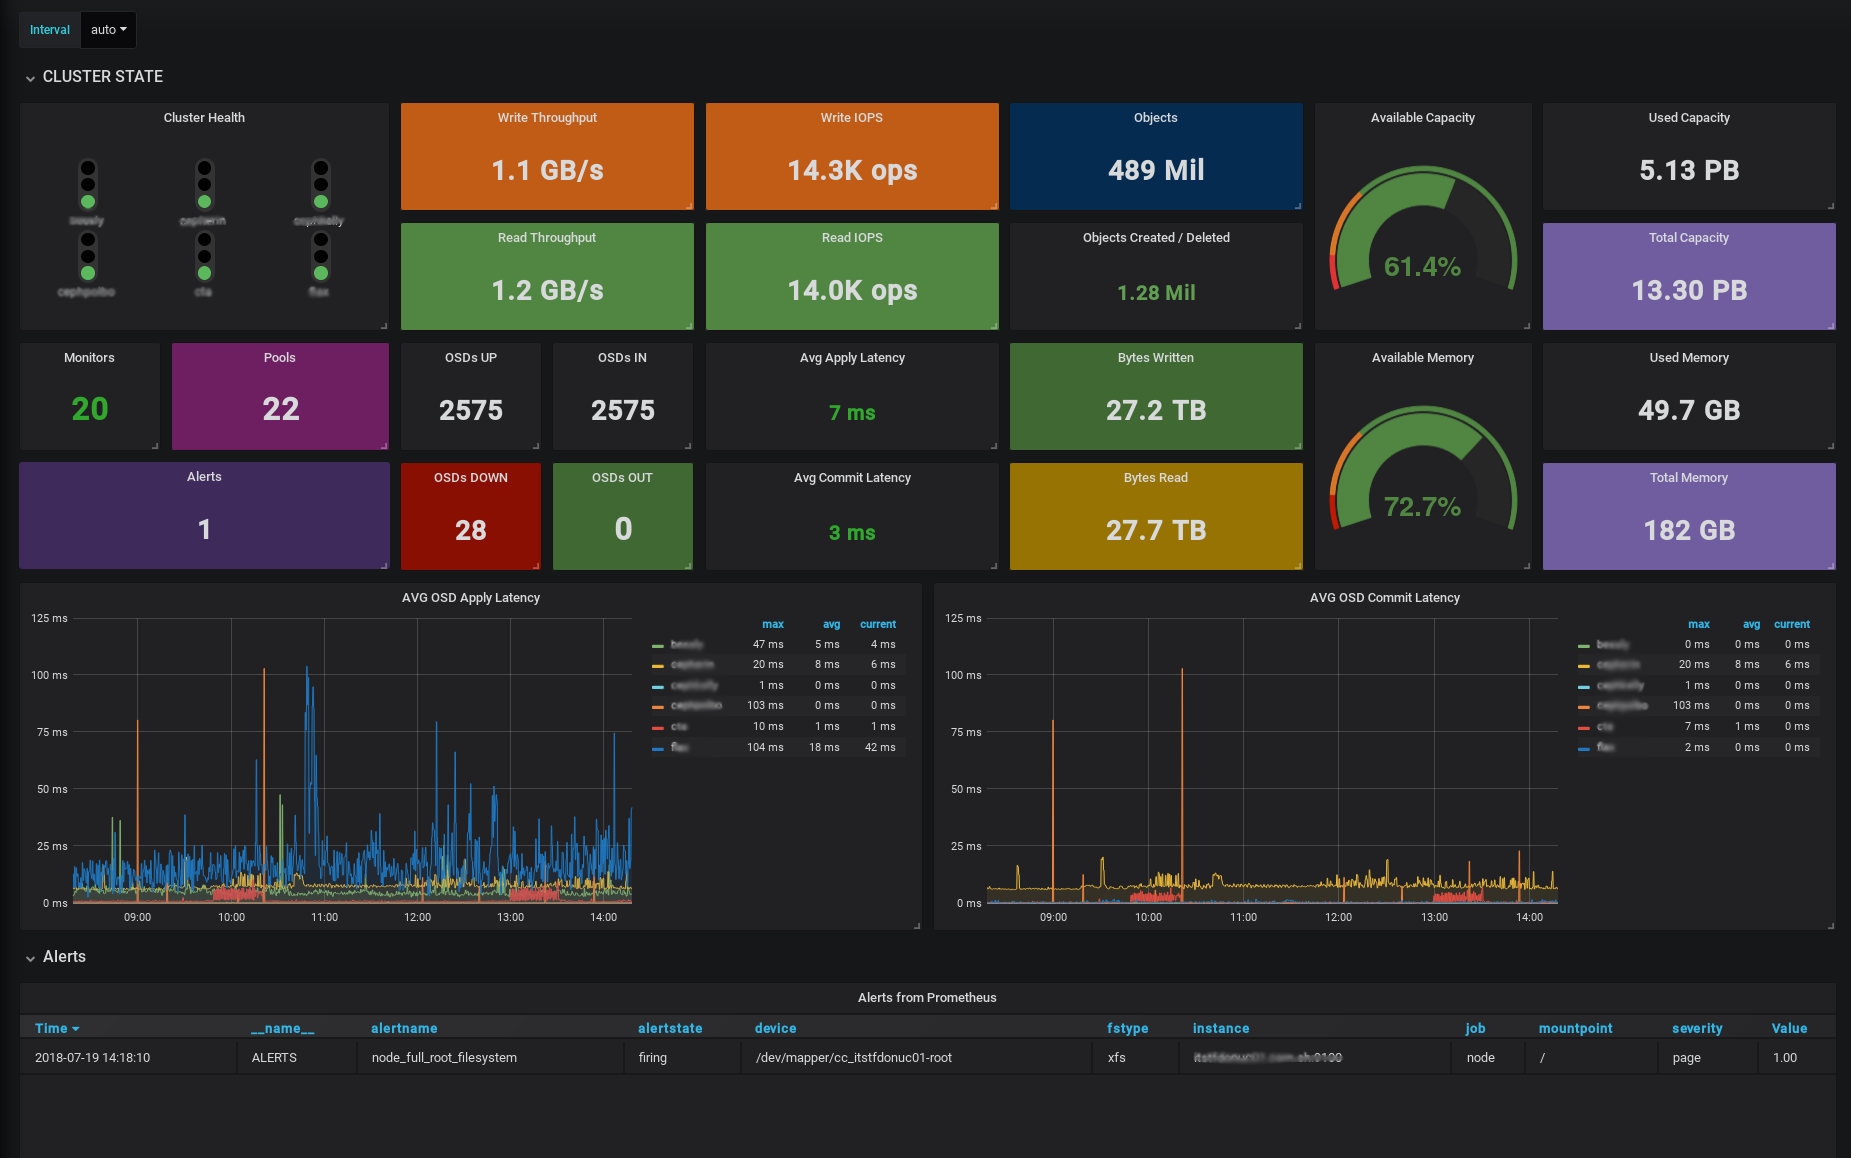
Description
This dashboard is targeted for service managers or teams which manage more than one ceph instances. It shows all the stats combined and also is possible to create comparison graphs between clusters. This dashboard uses native ceph prometheus module (ceph_exporter not needed) for ceph stats and node exporter for node stats
Requisites
- Ceph Luminous (12.2) or Ceph Mimic (13.2)
- Node Exporter for node metrics
Setup
- Enable ceph prometheus module:
ceph mgr module enable prometheus - Allow traffic through the port
9283of the machines containing the ceph mgr. - To ensure that you don't lose the metrics between mgr fail-overs, add all the mgr to the target section in prometheus.
- To allow "by cluster" metrics, create a new label when defining the targets, like:
{
        "targets": [ "mycluster-mgr-1:9283", "mycluster-mgr-2:9283", "mycluster-mgr-3:9283" ],
        "labels": {
           "cluster":"mycluster"
        }
}
Data source config
Collector type:
Collector plugins:
Collector config:
Revisions
Upload an updated version of an exported dashboard.json file from Grafana
| Revision | Description | Created | |
|---|---|---|---|
| Download |
Ceph
Monitor Ceph with Grafana. Easily keep tabs on your cluster with Grafana Cloud's out-of-the-box monitoring solution.
Learn more