Cosmos Network Dashboard
Should provide an overview over a node in the cosmos network using Prometheus
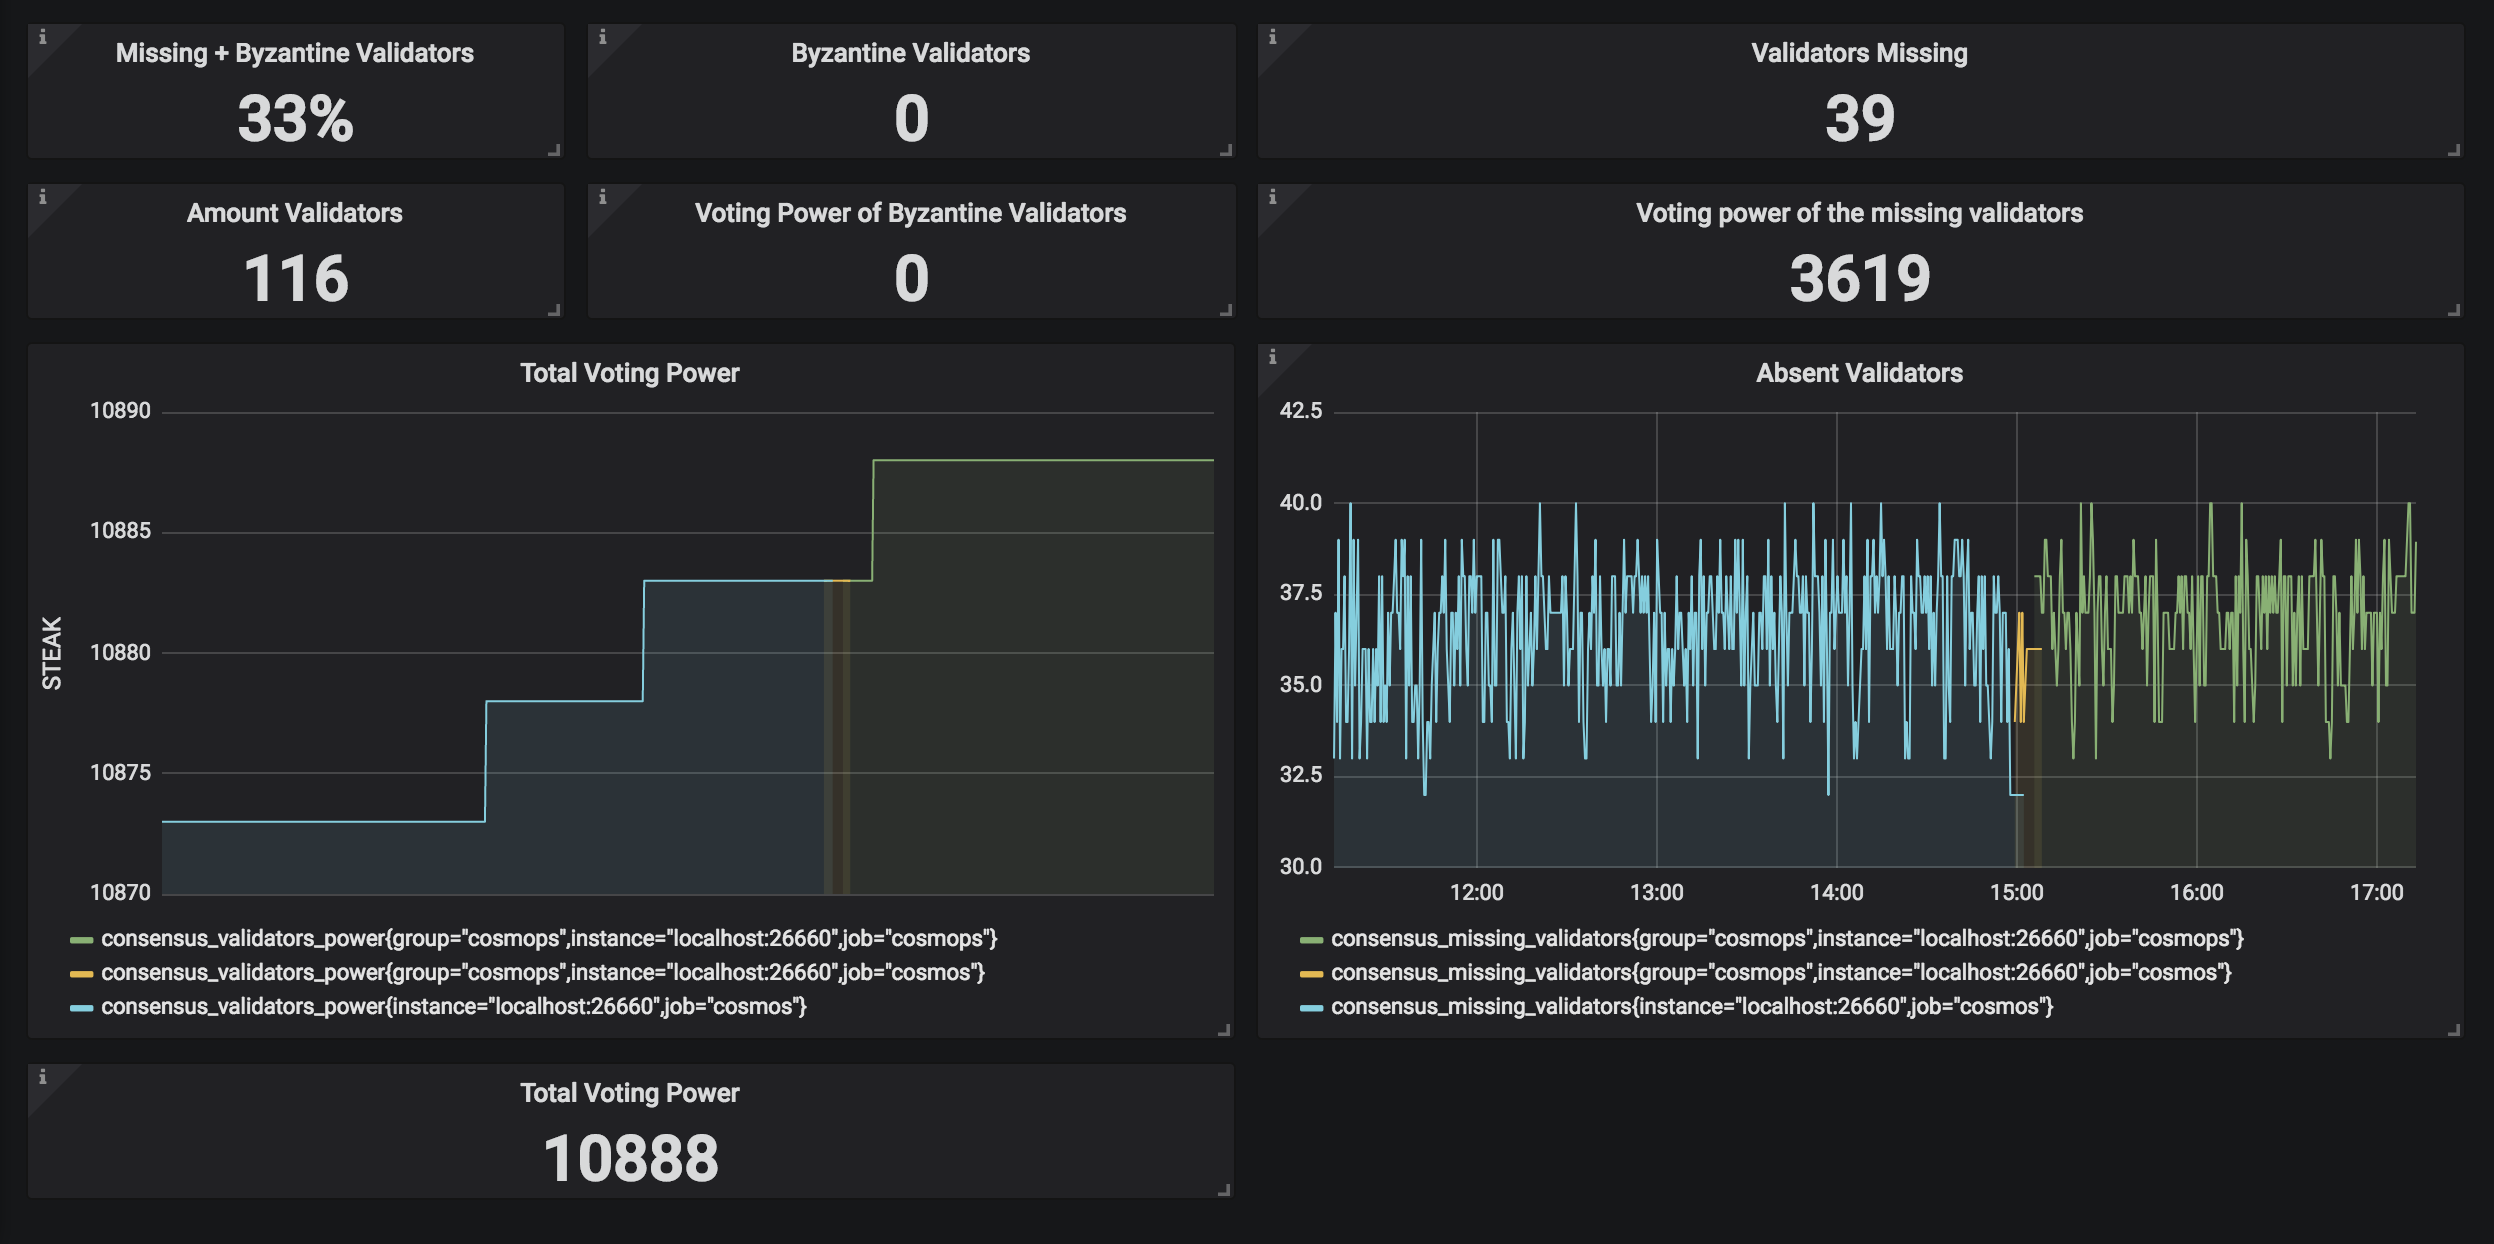
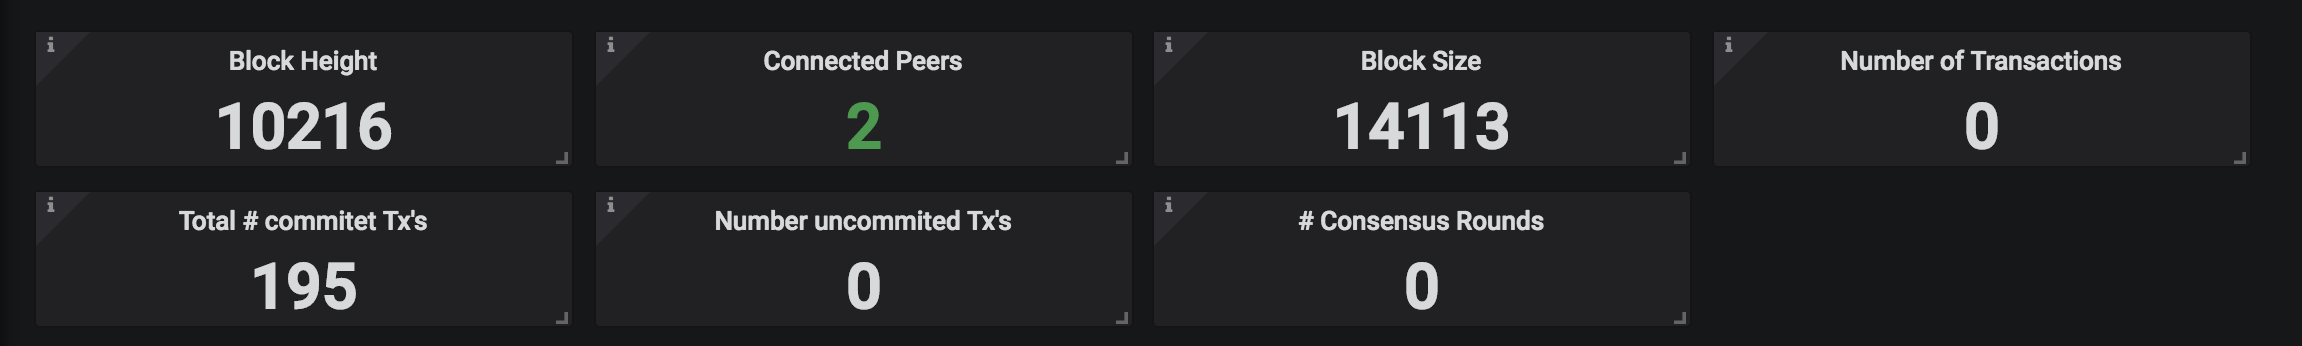
This is a first draft of a cosmos network dashboard used to monitor a node. All known endpoints/metrics are used, however 'consensus_block_interval_seconds' doesn't seem to work. Anyone feel free to improve this. :)
Data source config
Collector type:
Collector plugins:
Collector config:
Revisions
Upload an updated version of an exported dashboard.json file from Grafana
| Revision | Description | Created | |
|---|---|---|---|
| Download |
Azure Cosmos DB
With the Grafana plugin for Azure Cosmos DB, you can quickly visualize and query your Azure Cosmos DB data from within Grafana.
Learn more