Amazon RDS OS Metrics
Visualize OS metrics for Amazon RDS instance
This dashboard can be used with any DB engine of Amazon RDS including MySQL, Aurora etc.
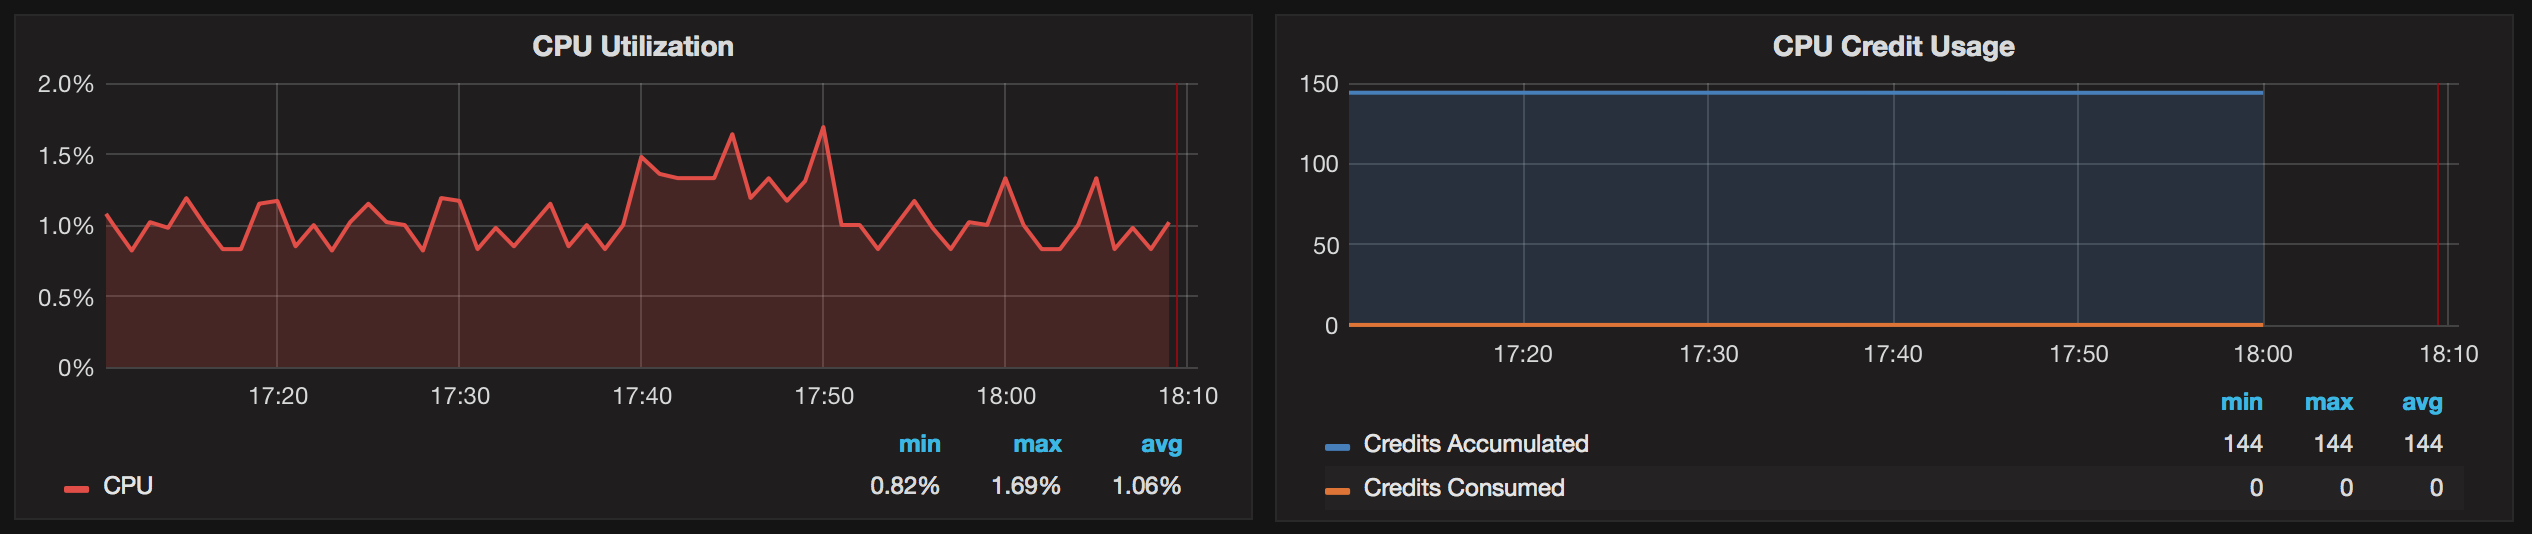
It uses 60s resolution and shows an average over each datapoint. An exception is “CPU Credit Usage” graph which has 5 min. average and interval length.
Setup
Add CloudWatch datasource to Grafana choosing any region, the rest of the fields can be left blank.
Create IAM user and attach the managed policy CloudWatchReadOnlyAccess. Then put the credentials in the file ~grafana/.aws/credentials:
[default]
aws_access_key_id = youraccesskeyid
aws_secret_access_key = yoursecretaccesskey
Import this dashboard, select your region, instance and see the graphs.
Feeback
Data source config
Collector config:
Upload an updated version of an exported dashboard.json file from Grafana
| Revision | Description | Created | |
|---|---|---|---|
| Download |
Amazon Aurora
With the Grafana plugin for Amazon Aurora, you can quickly visualize and query your Amazon Aurora data from within Grafana.
Learn more