
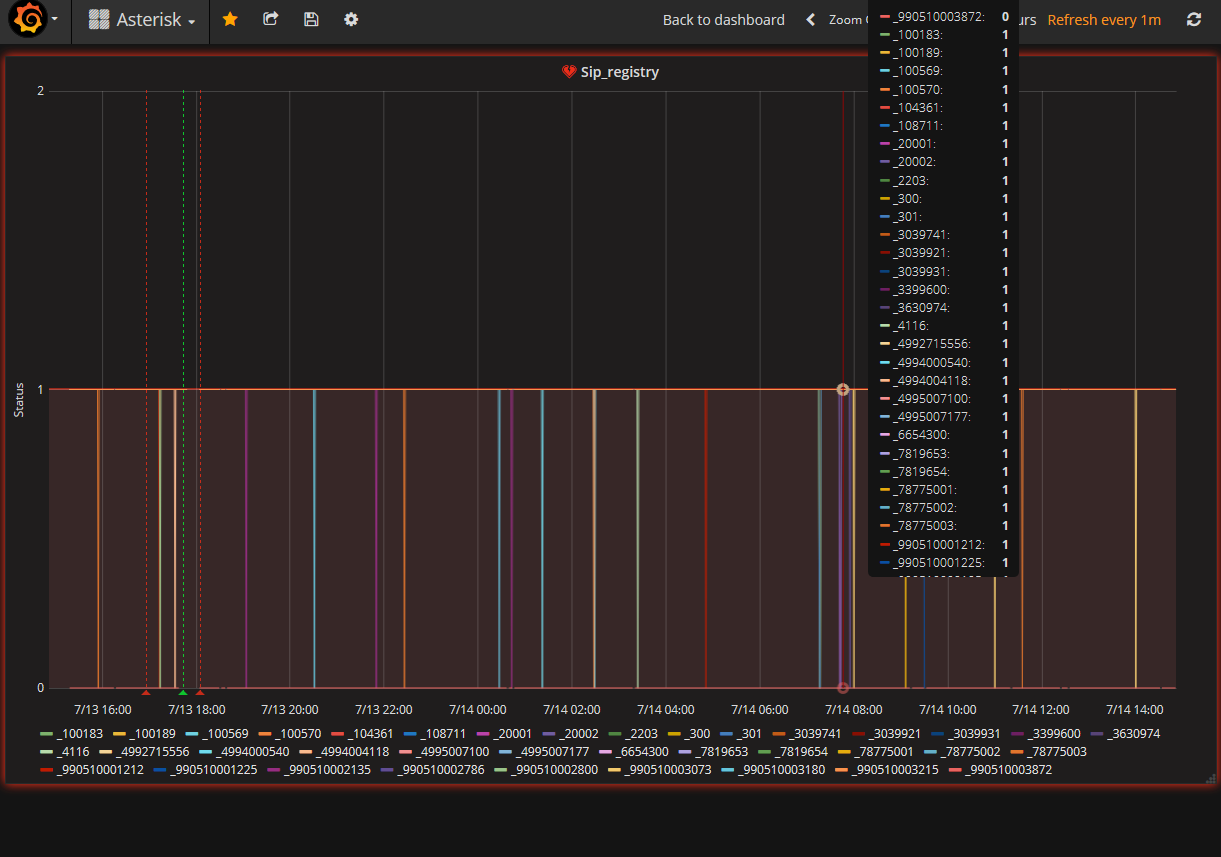
Asterisk monitoring trunk
Monitoring trunks using the Grafana display system, sending telegraf data, storing influxdb values and the docker container system. Script: https://drive.google.com/file/d/1y6msChfxE3KL30xYhEcHgdgxxwuj5-jb/view?usp=sharing Config influx: https://drive.google.com/file/d/1YwvwMFjigE82yIQXb3oQyOESS0h-Piul/view?usp=sharing Config telegraf: https://drive.google.com/file/d/13ReO2YGp9tianoXjMGY4DGzsfl6AKW2t/view?usp=sharing If you have a questions, please write me on sord23@gmail.com
Data source config
Collector type:
Collector plugins:
Collector config:
Dashboard revisions
Upload an updated version of an exported dashboard.json file from Grafana
| Revision | Decscription | Created | |
|---|---|---|---|
| Download |
Sign up for Grafana Cloud

Get up and running in minutes with the Grafana Cloud free tier, which includes free forever 10k metrics, 50GB logs, 50GB traces, 500 VUh, and more.
Get this dashboard
Data source:
Dependencies: