OpenSIPS
This dashboard shows everything you'd ever want to know about your OpenSIPS instances!
In order to get this dashboard to work you need to collect metrics using the OpenSIPS exporter for Prometheus. You can find some examples in the GitHub repo on how to setup the exporter.
This dashboard also uses the node exporter to show some stats about CPU usage/network usage. The dashboard does work without it though, some graphs will just be empty if you don't use the node exporter.
The following graphs are included in the dashboard:
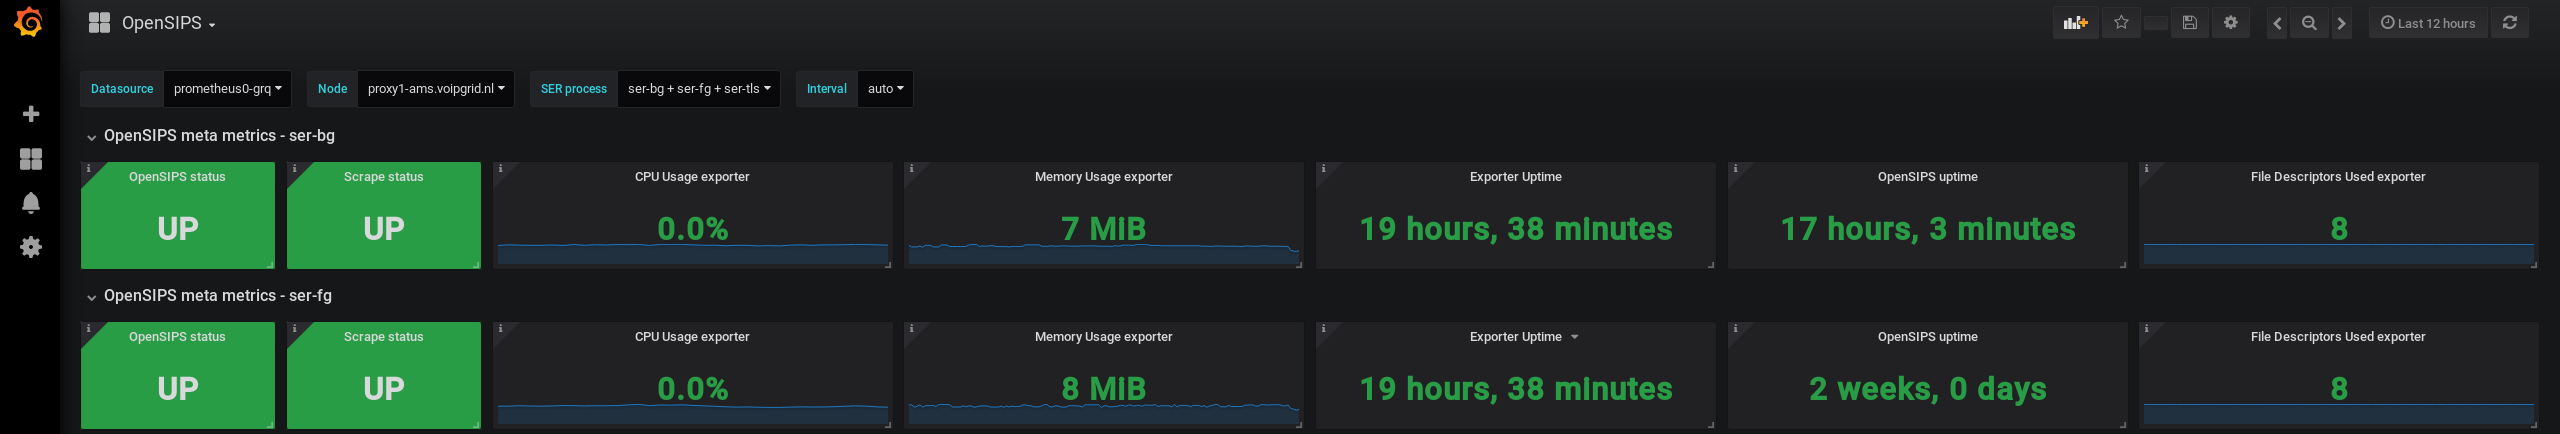
- 'Meta' metrics about exporter CPU/memory usage/uptime.
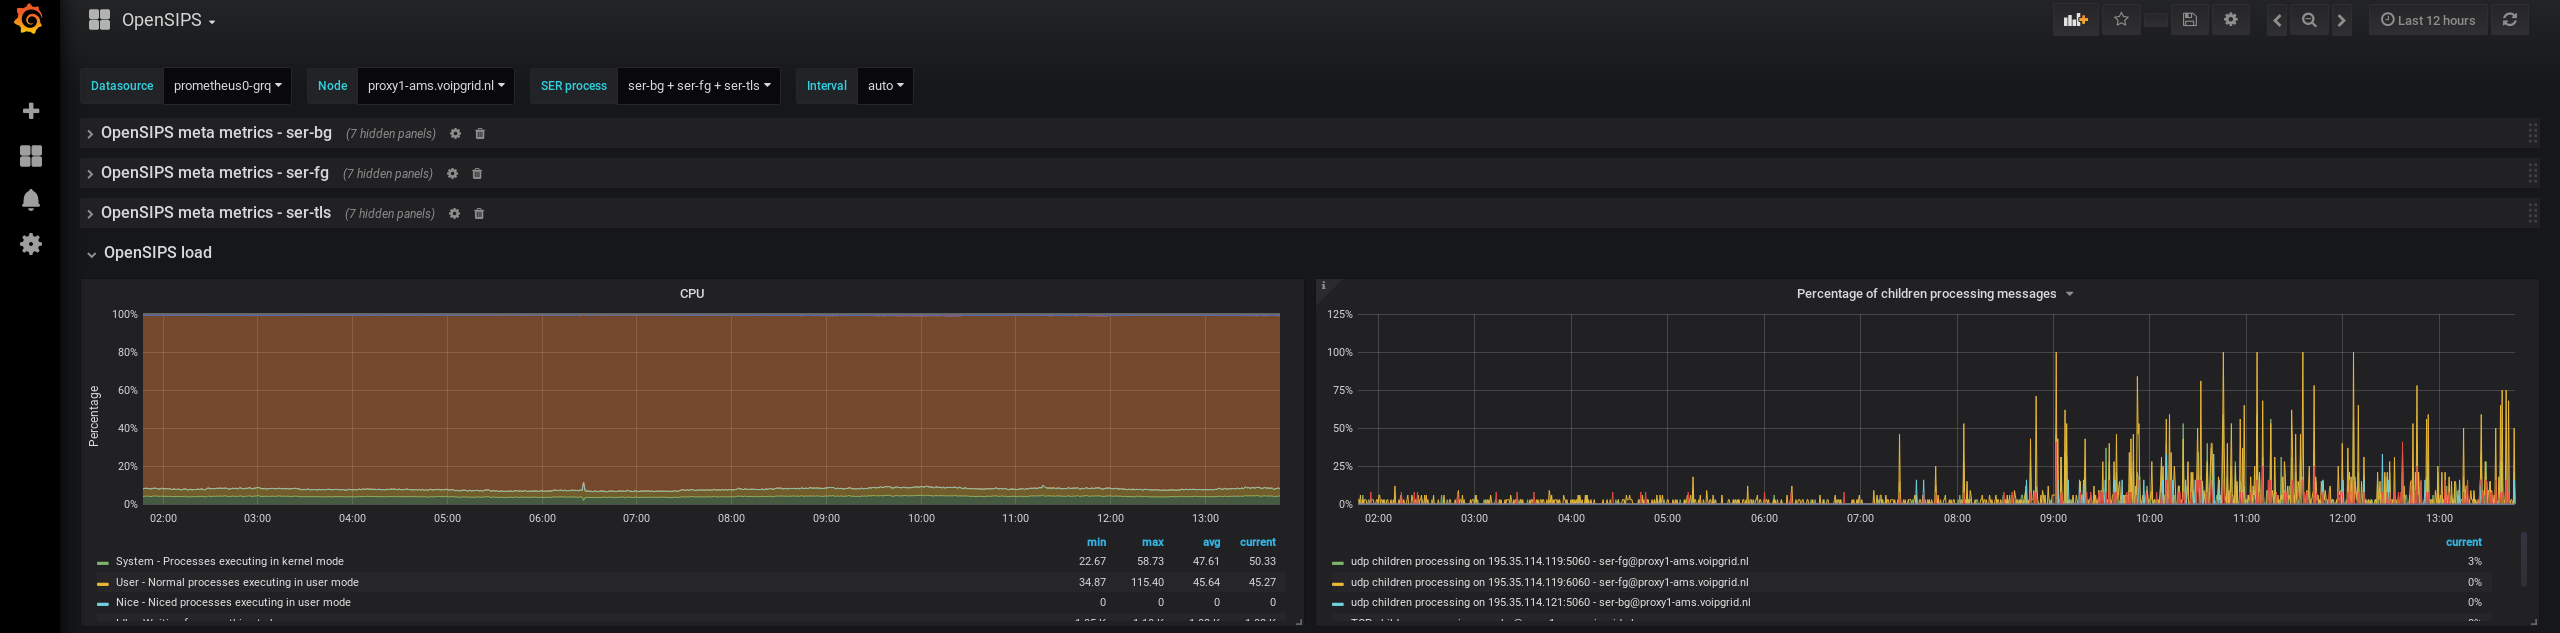
- OpenSIPS load (CPU/UDP & TCP children processing messages)
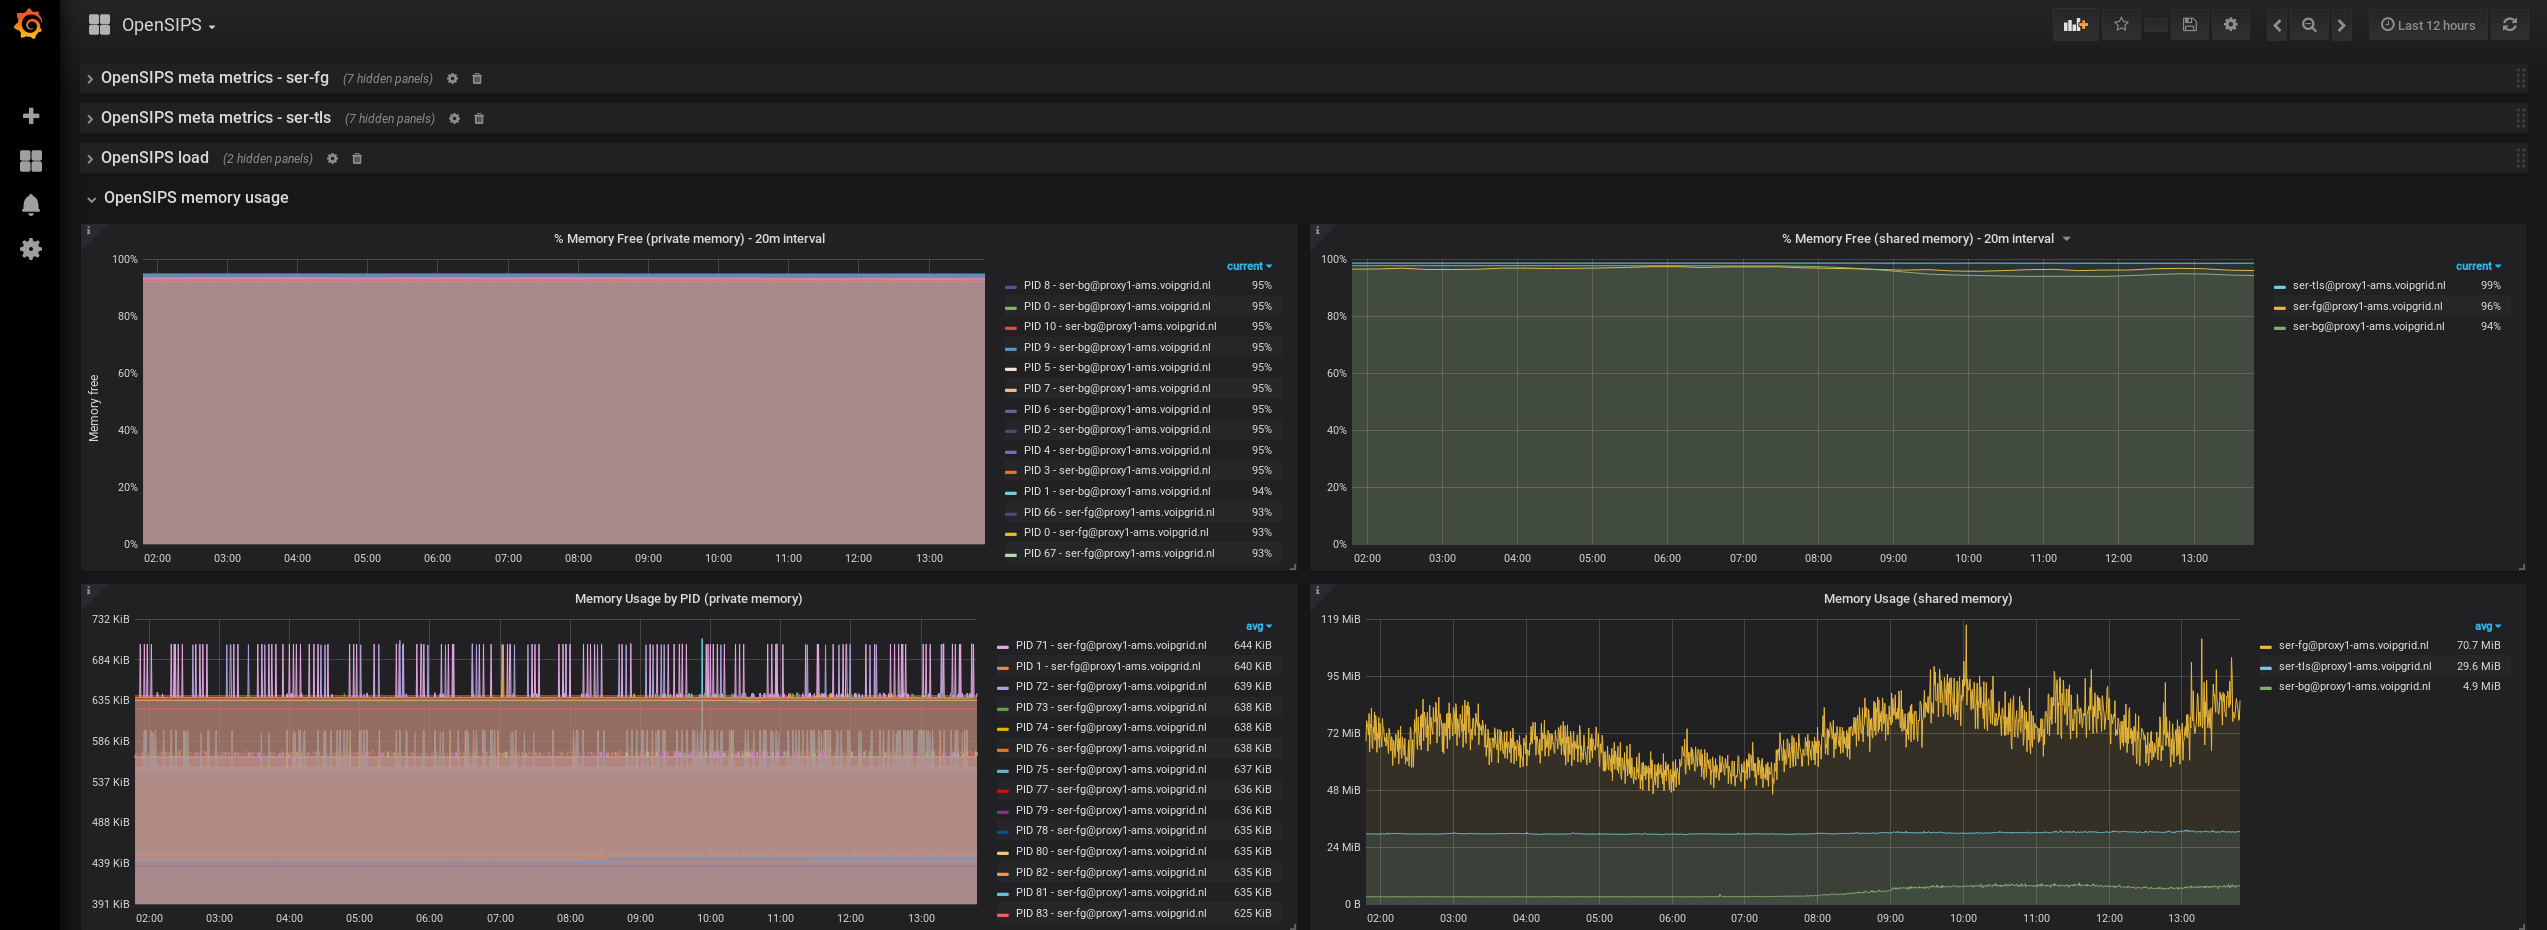
- OpenSIPS memory usage (per PID, % free, shared memory, private memory)
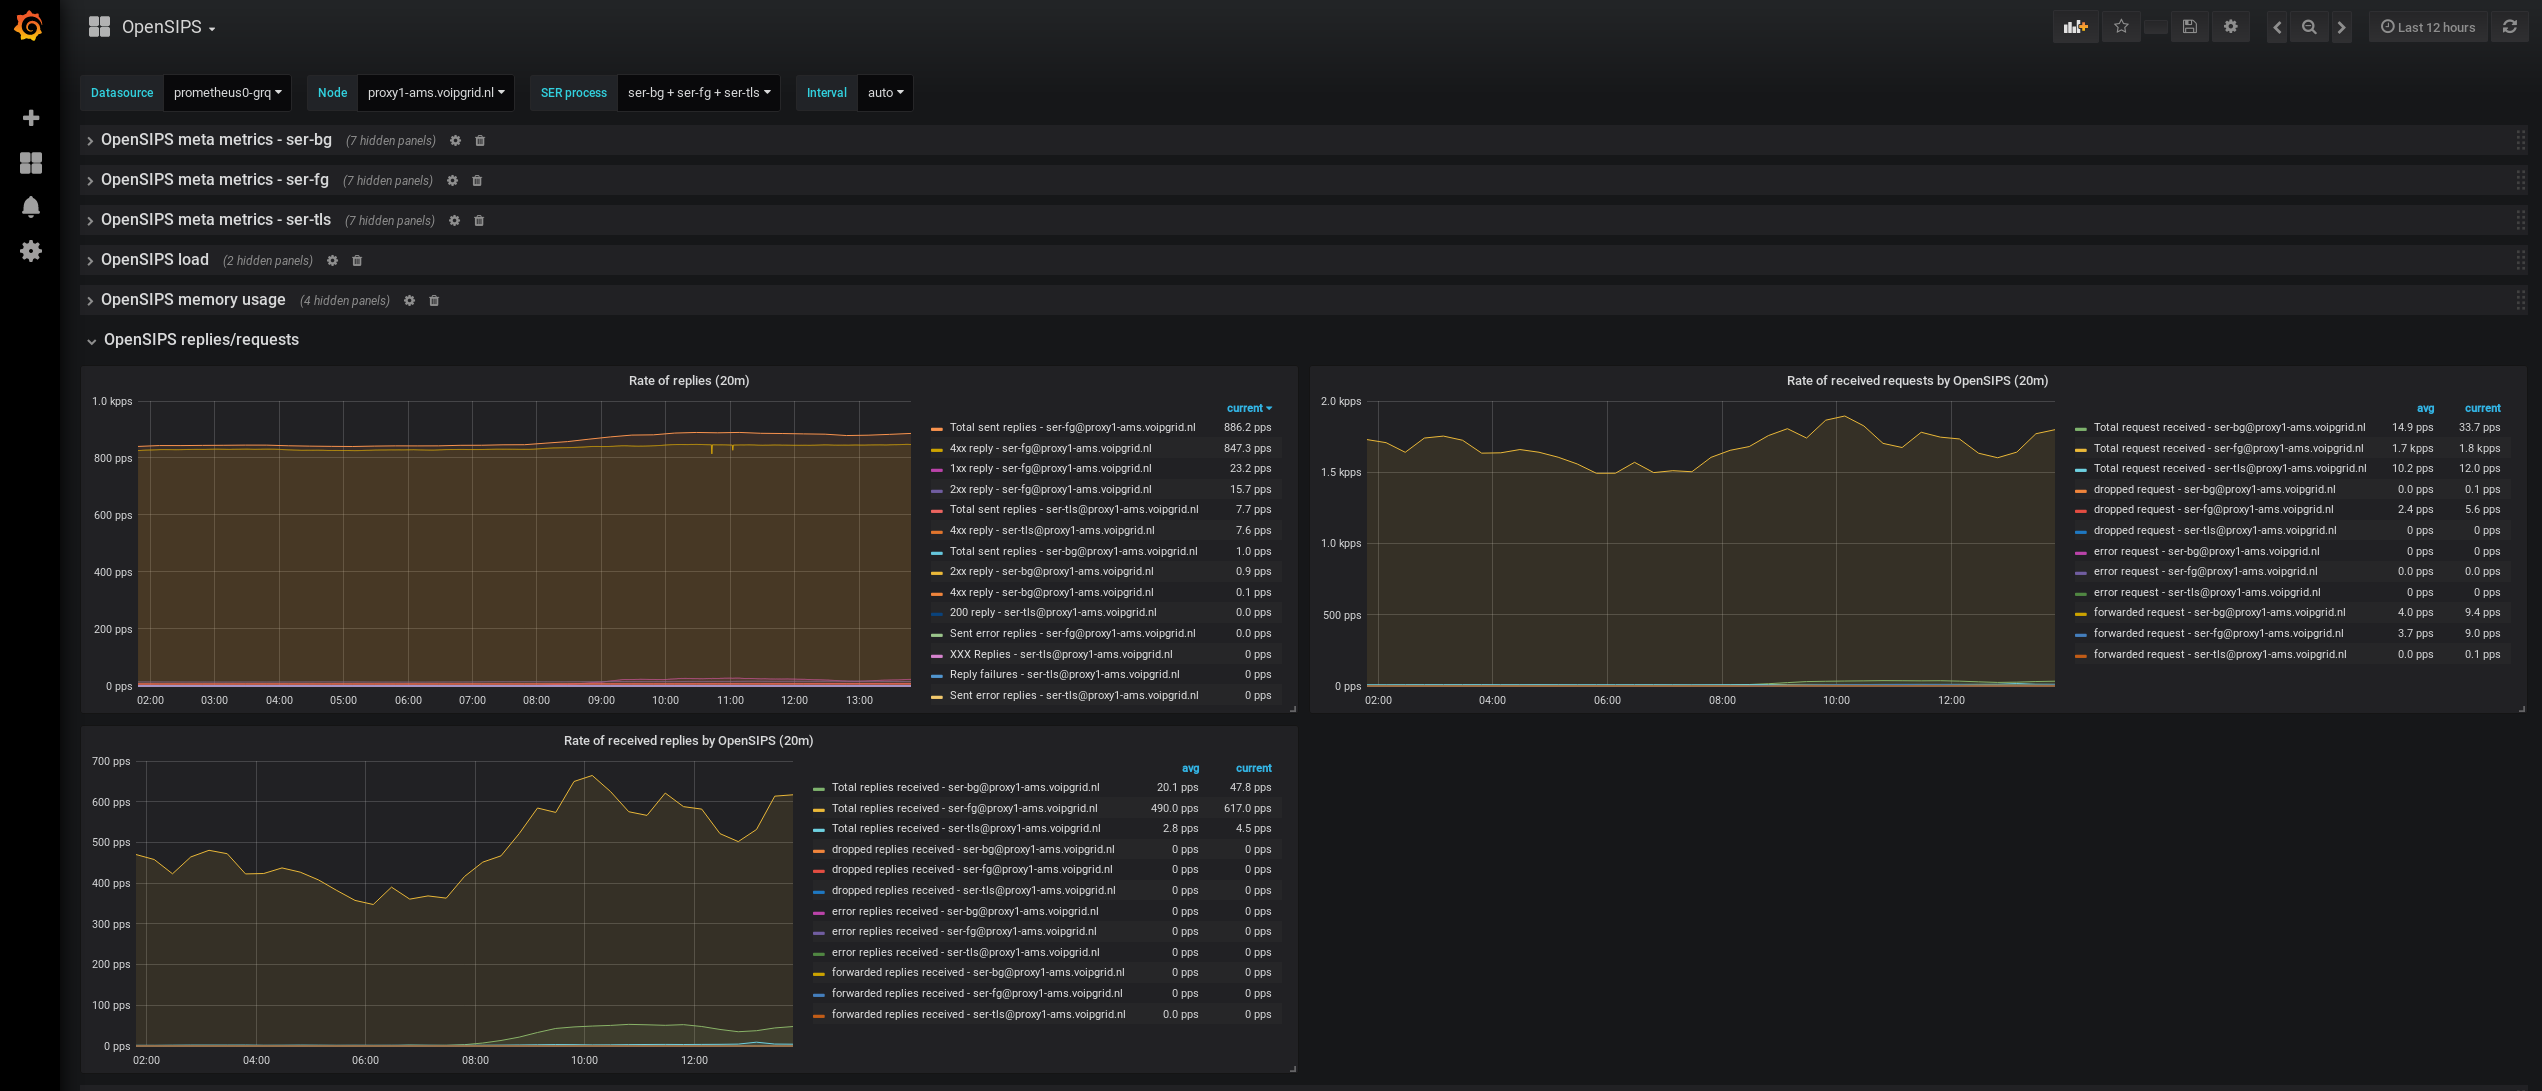
- OpenSIPS replies/requests (rate of replies/requests per type)
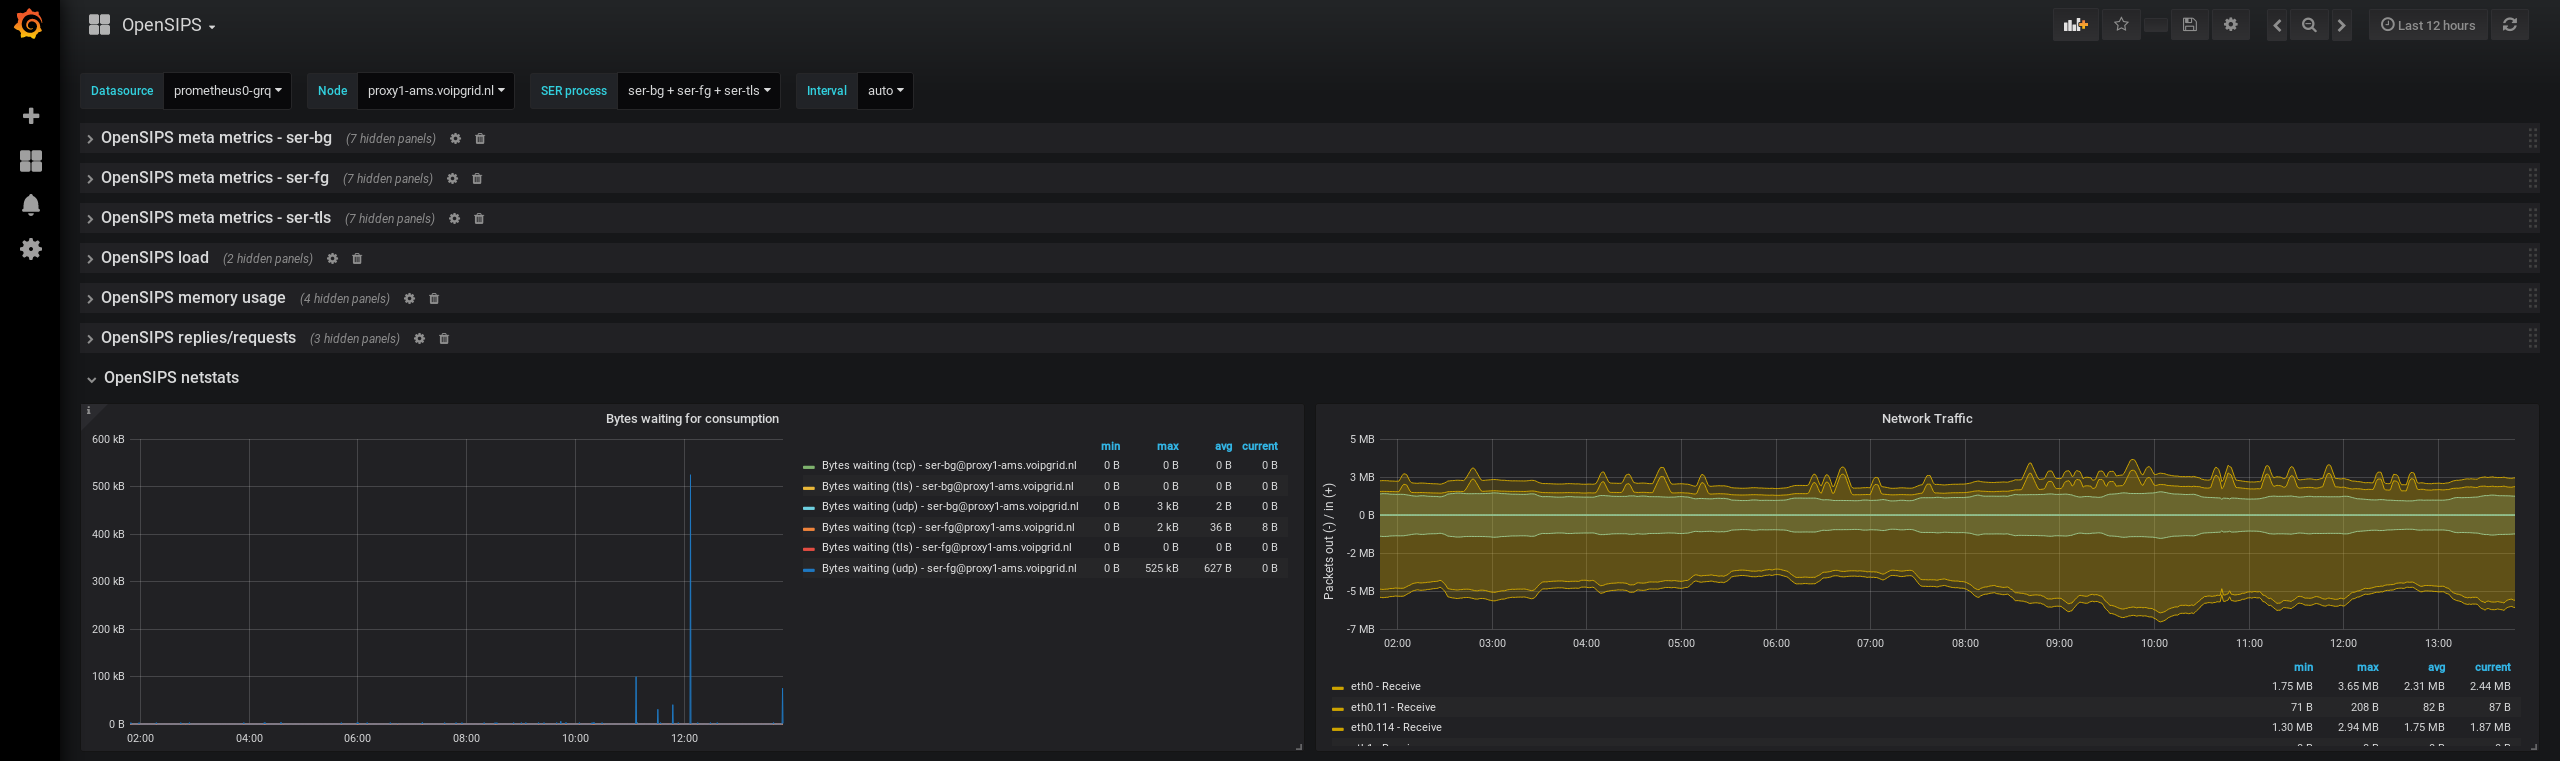
- OpenSIPS netstat (bytes waiting for consumption, network traffic)
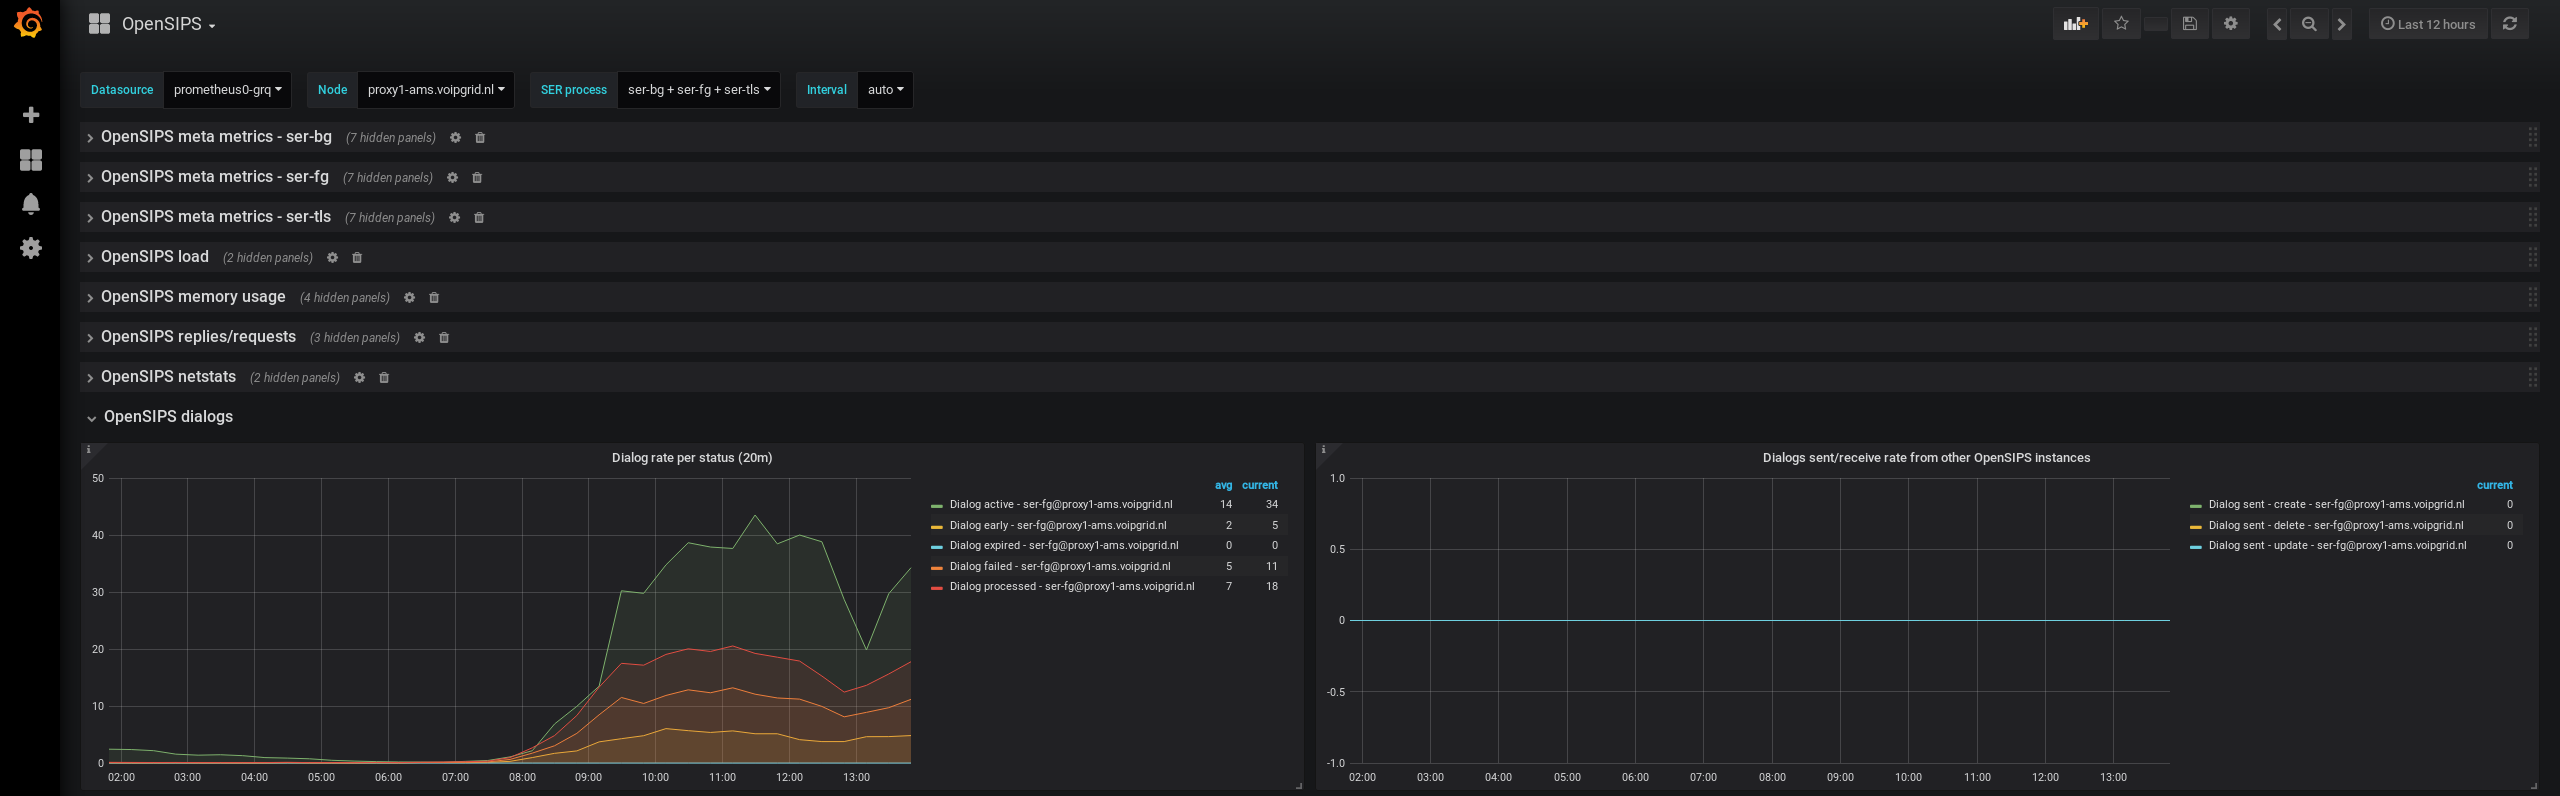
- OpenSIPS dialogs (dialog rate per status, dialogs from other OpenSIPS instances)
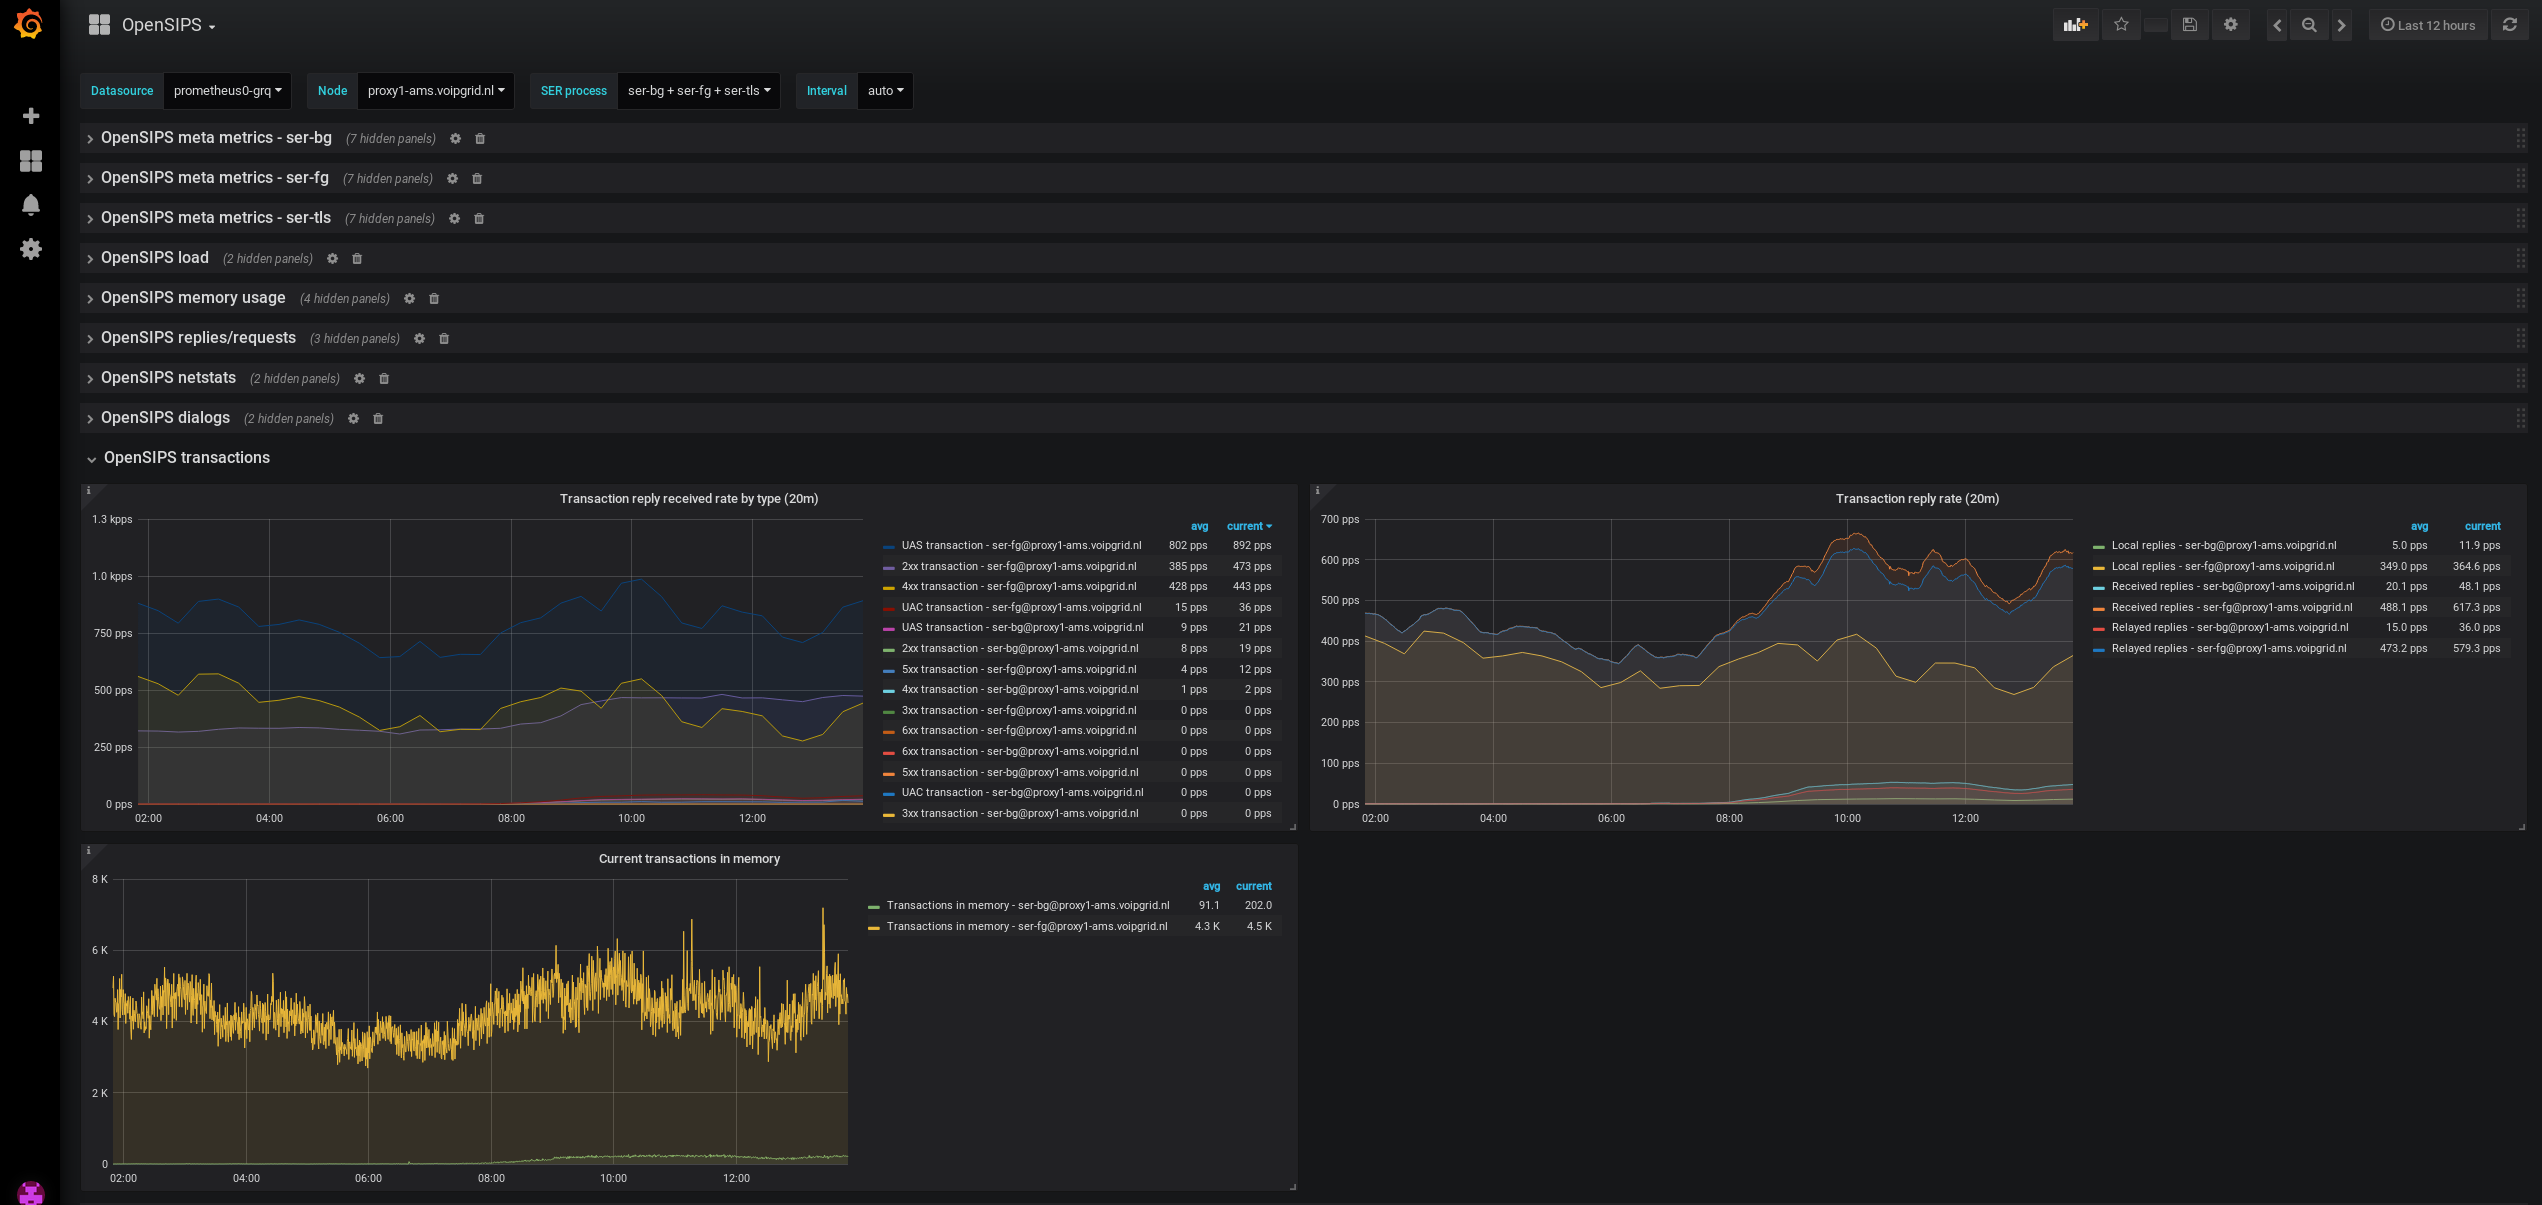
- OpenSIPS transactions (transactions reply rate per type, current transactions in memory)
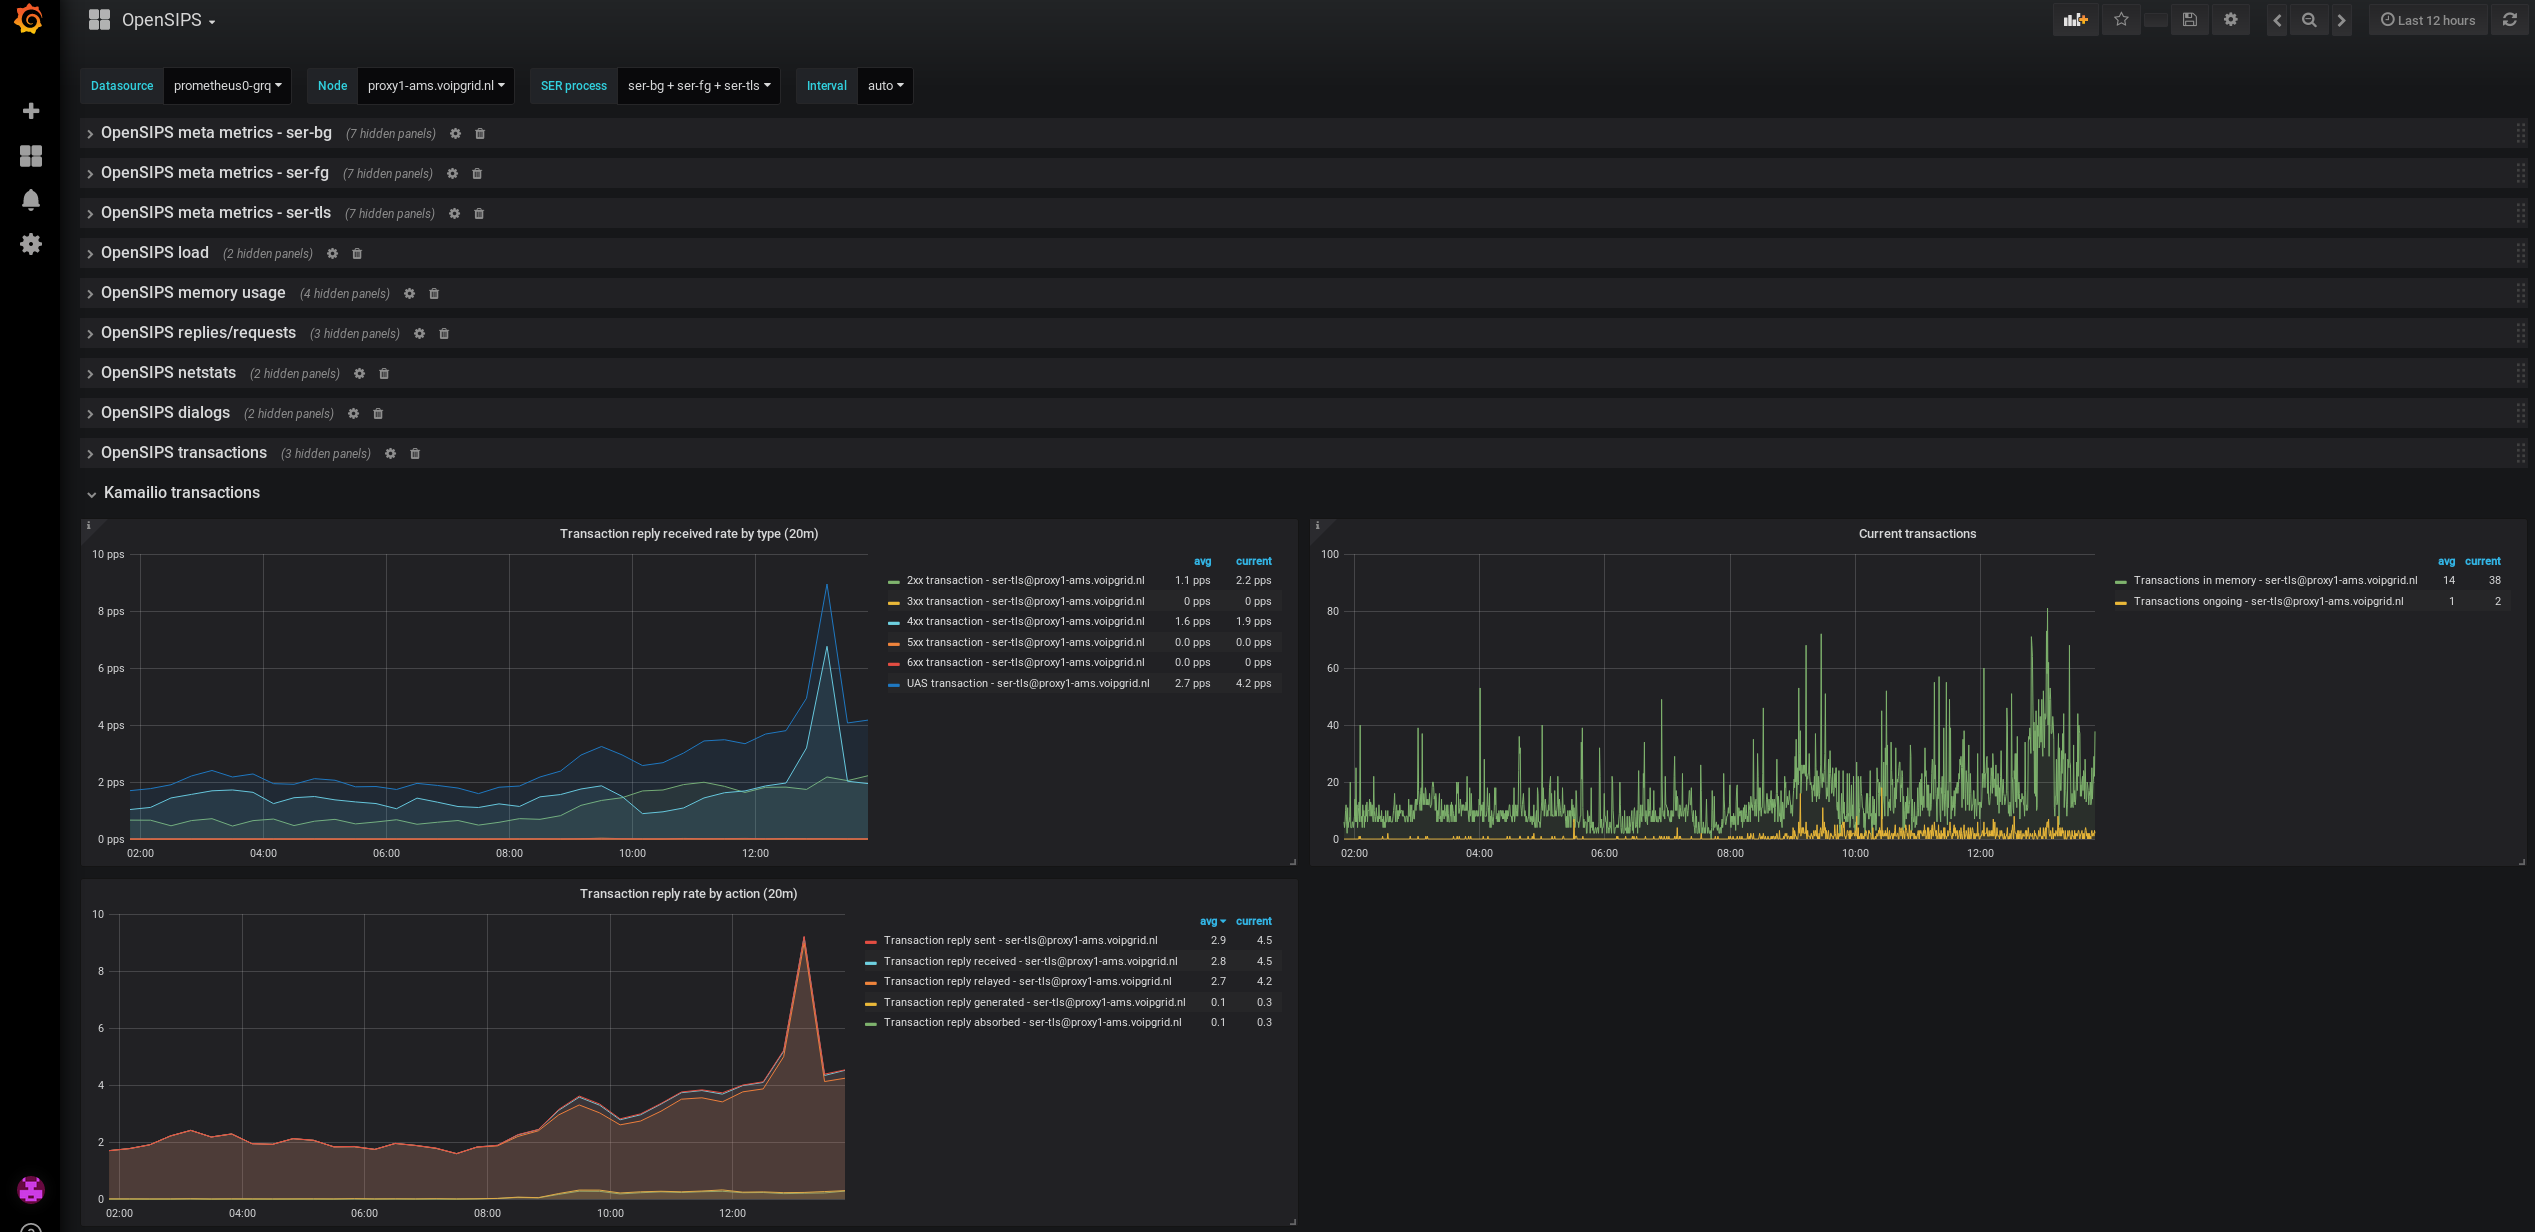
- Kamailio transactions (transactions reply rate per type, current transactions in memory)
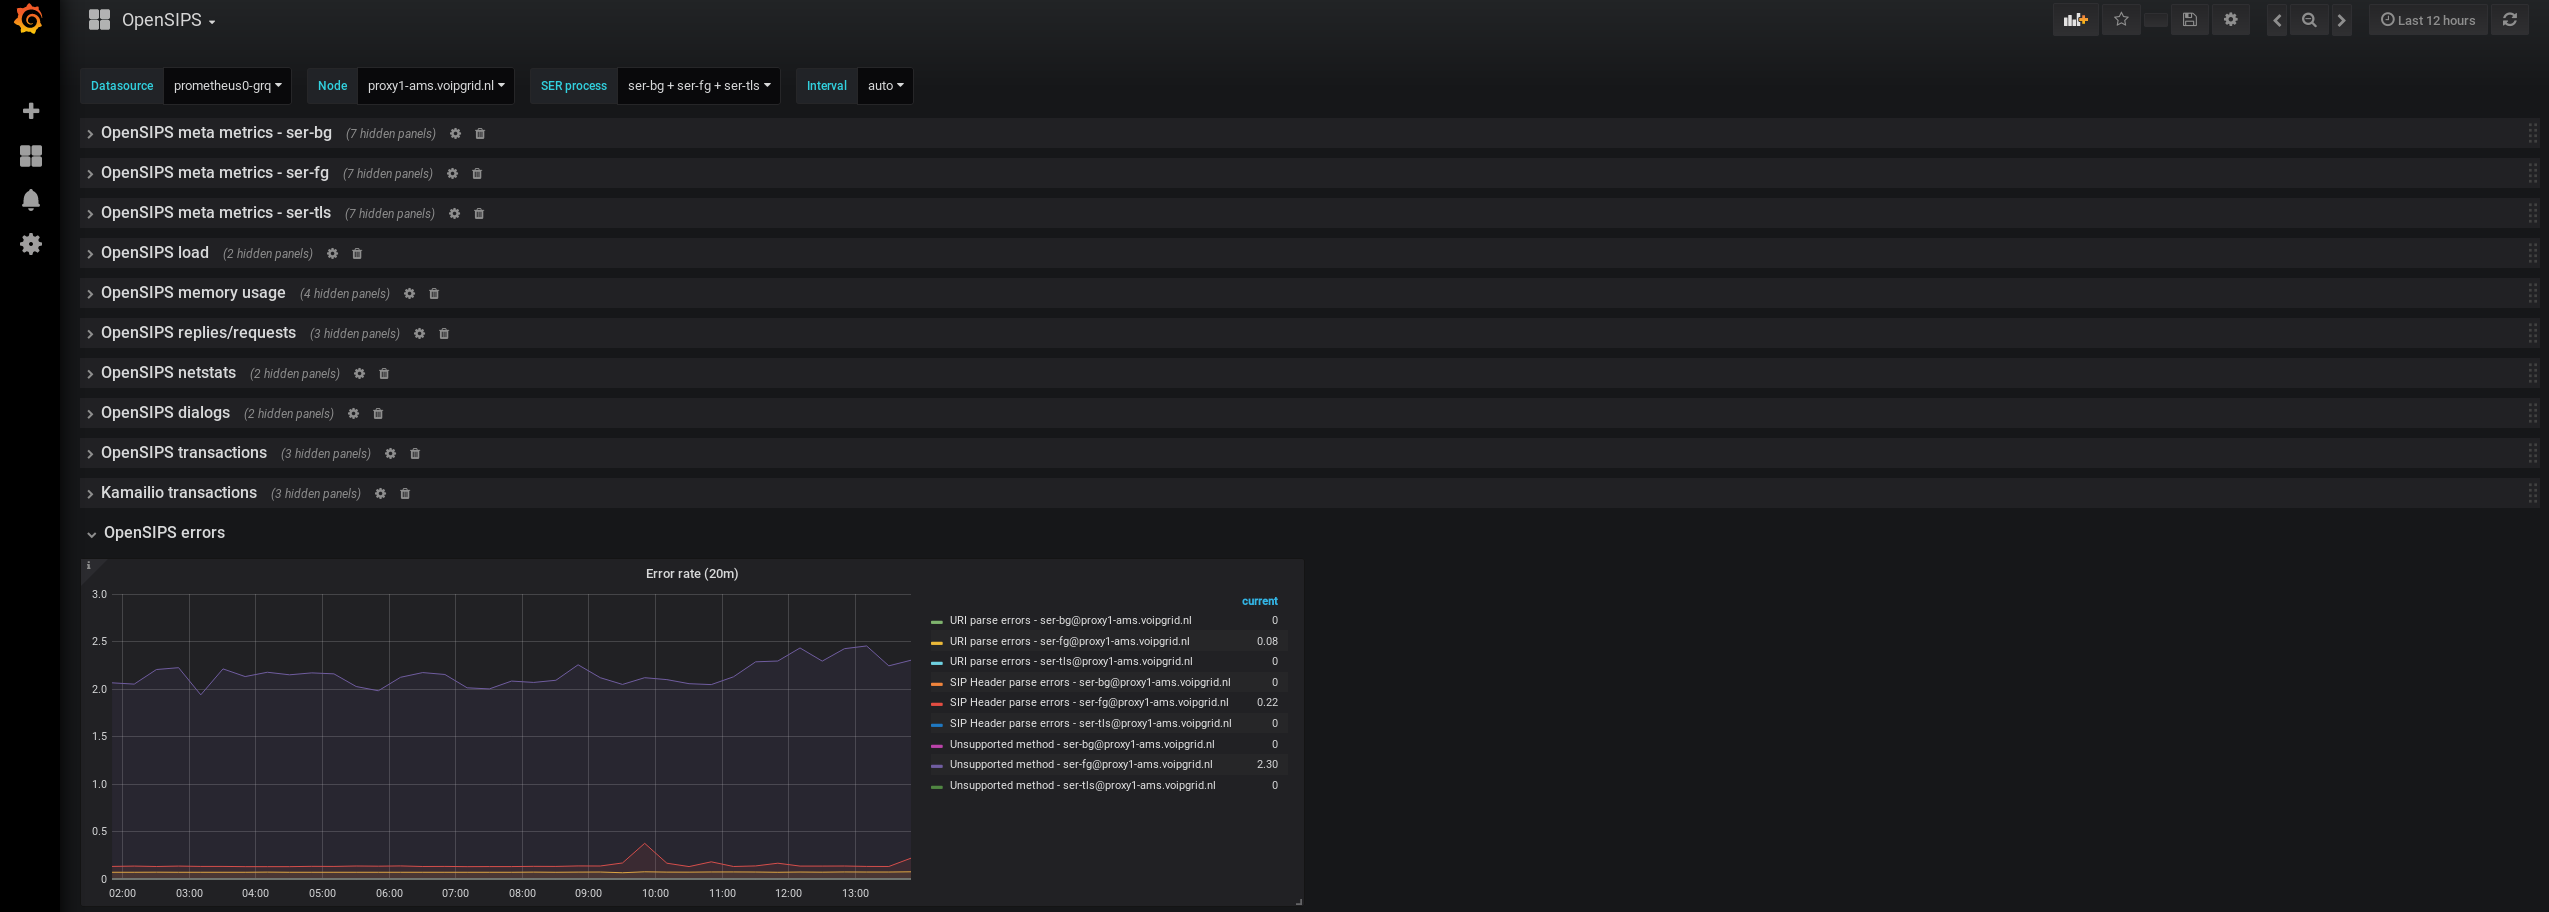
- OpenSIPS error rate
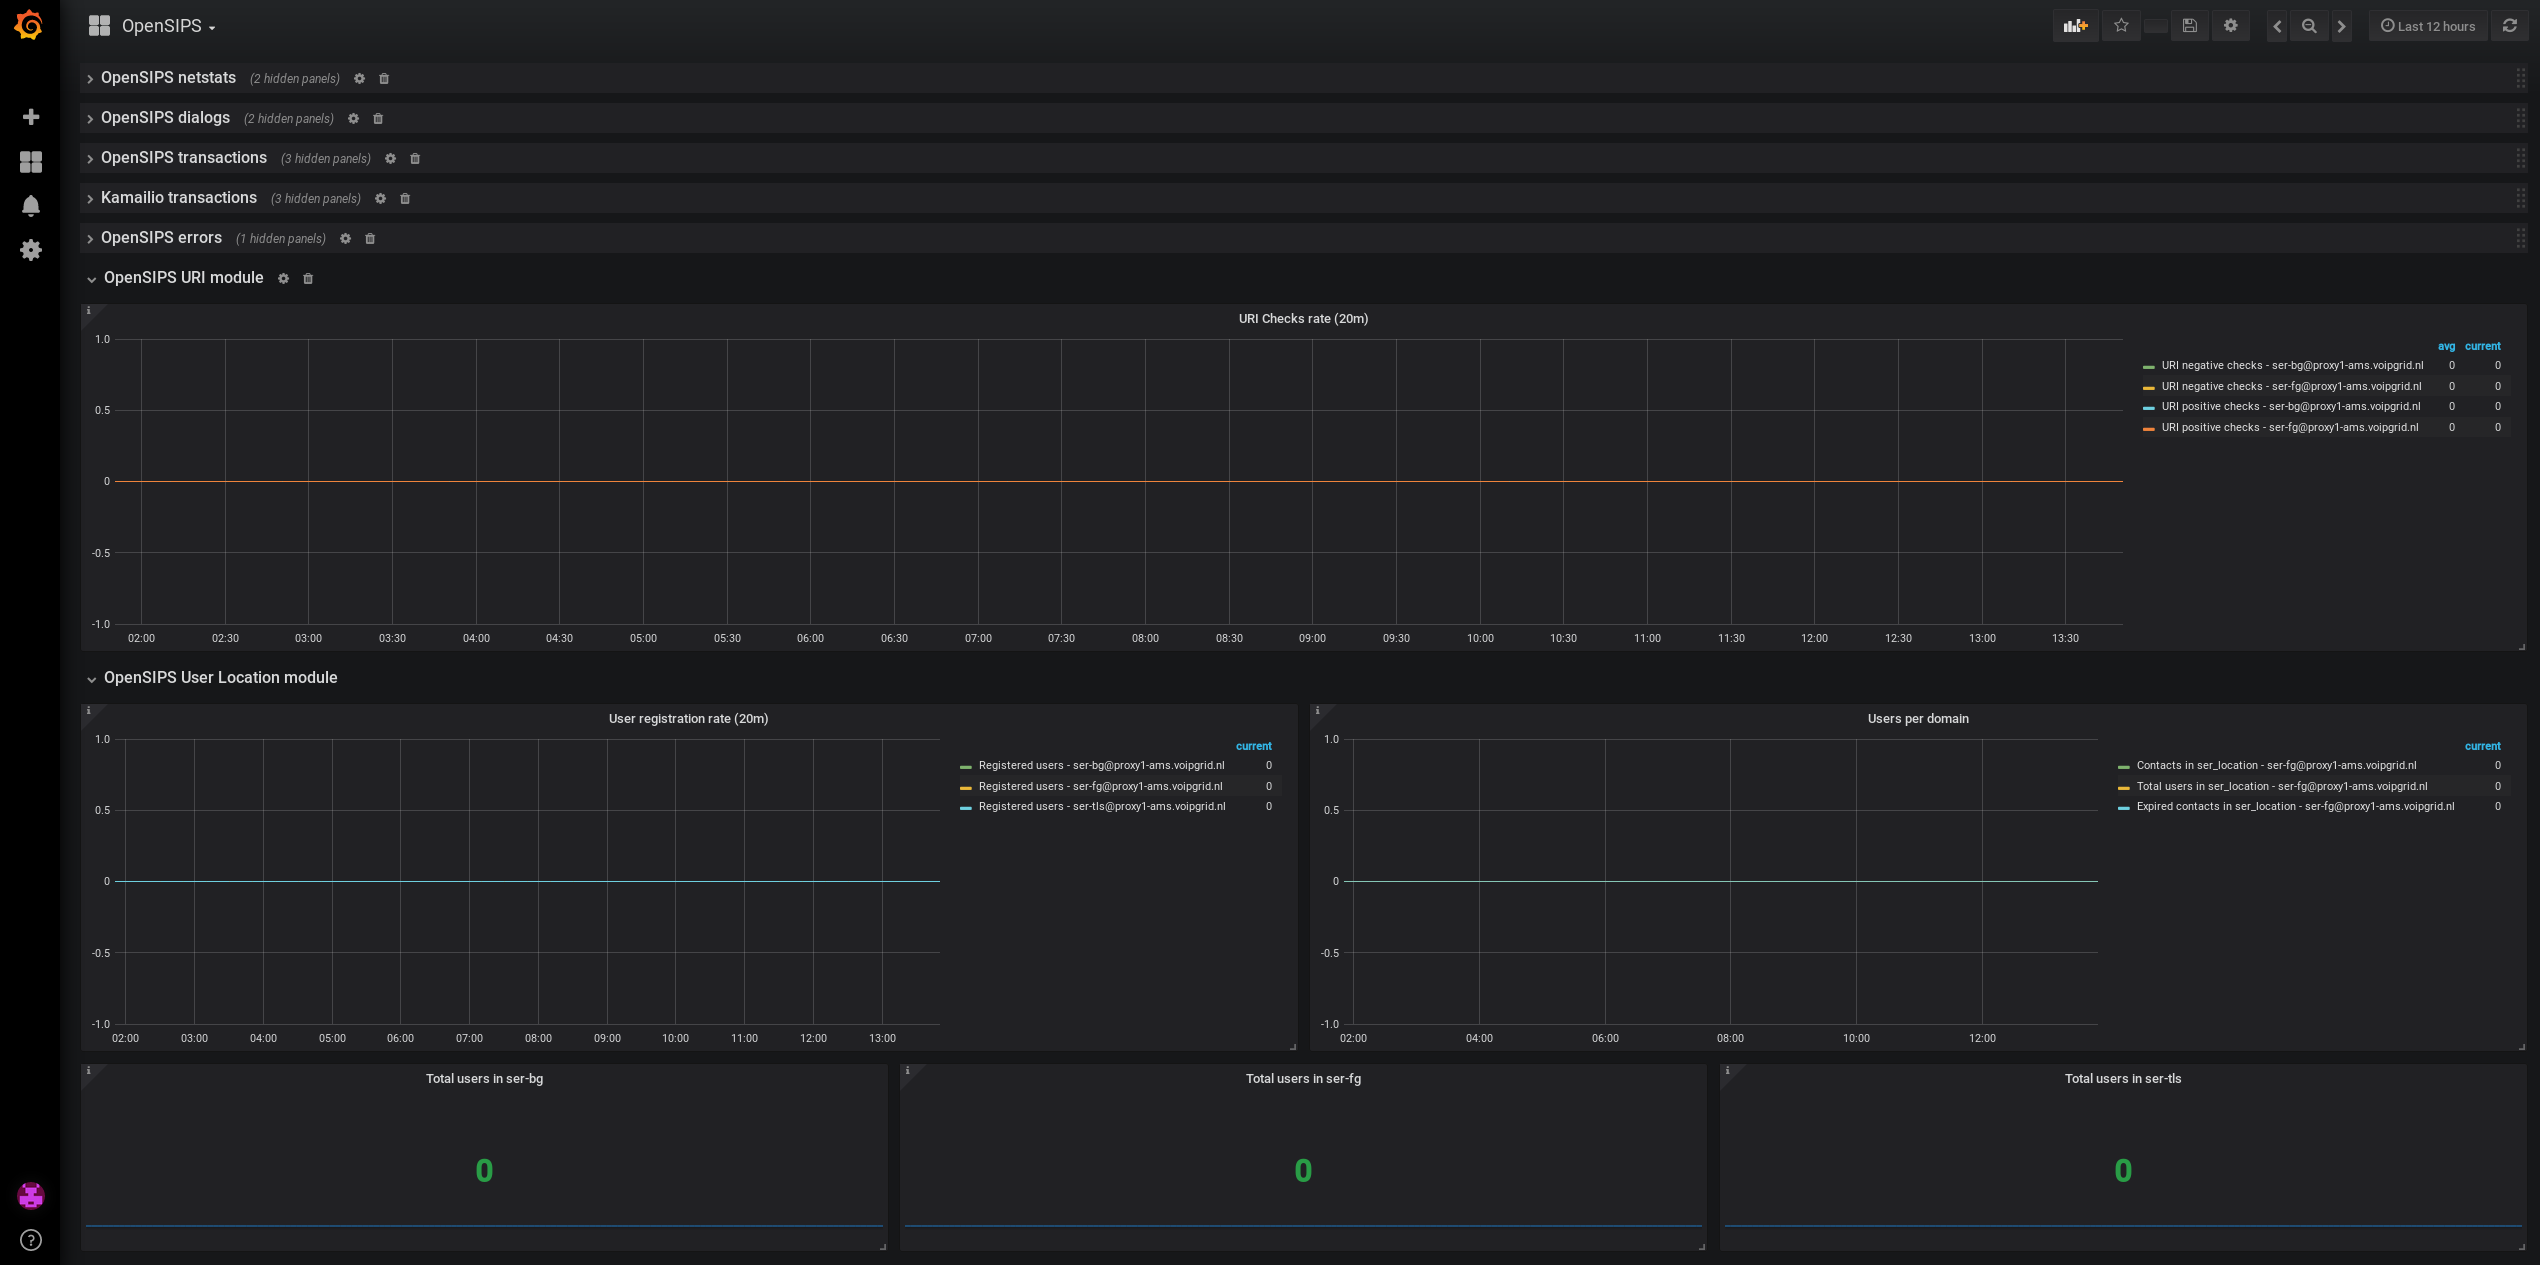
- OpenSIPS URI checks rate
- OpenSIPS User Location module (users per domain, user registration rate, users per OpenSIPS process)
Data source config
Collector type:
Collector plugins:
Collector config:
Revisions
Upload an updated version of an exported dashboard.json file from Grafana
| Revision | Description | Created | |
|---|---|---|---|
| Download |