
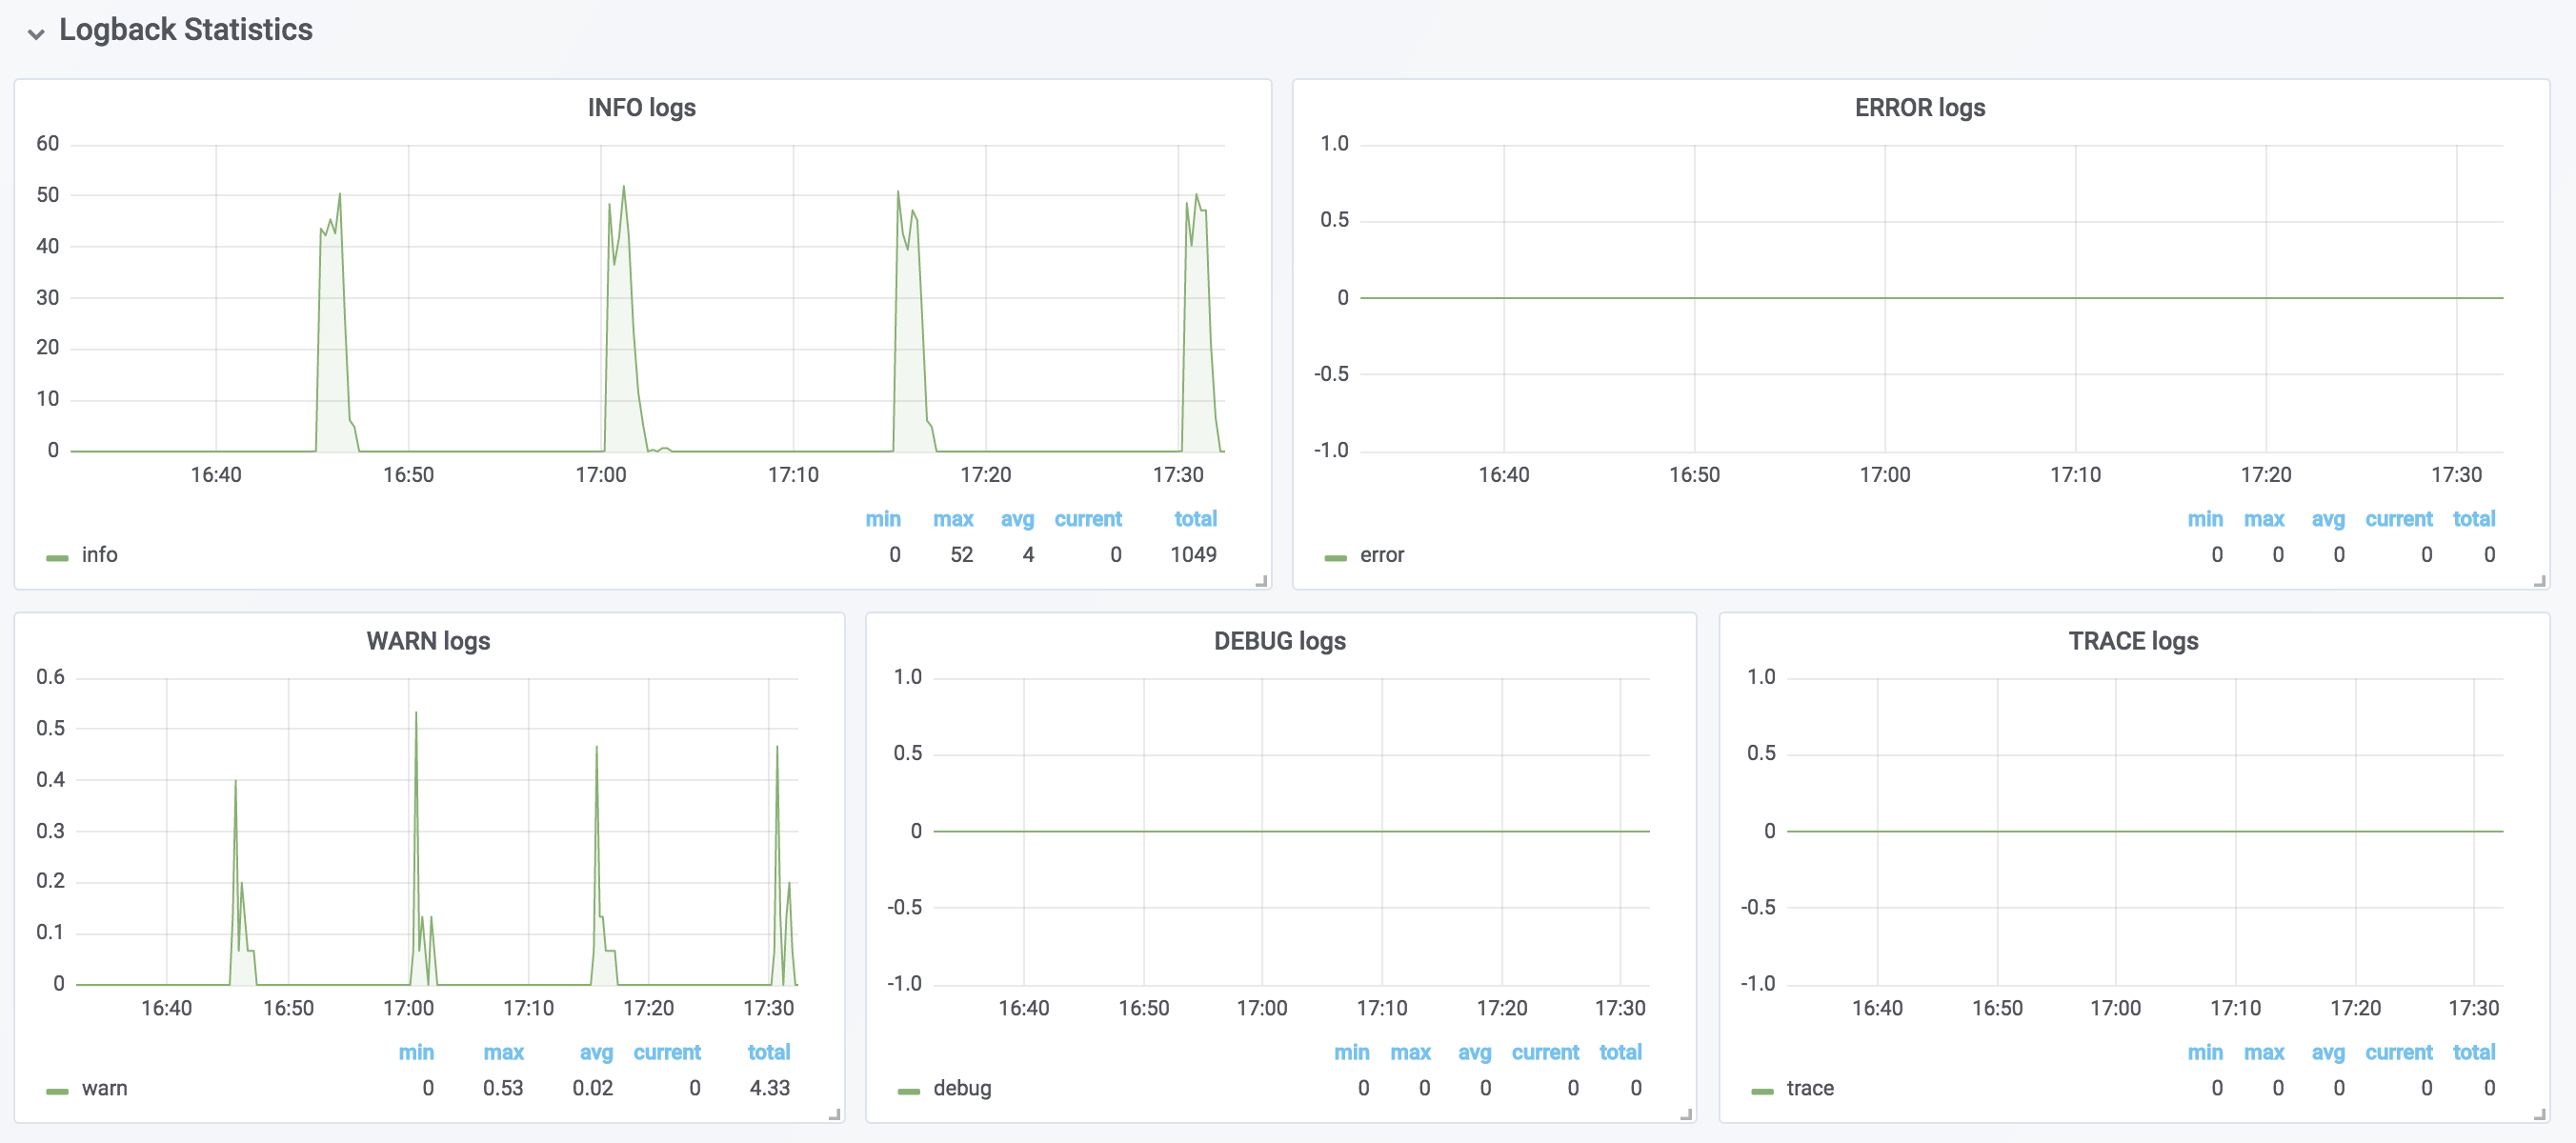
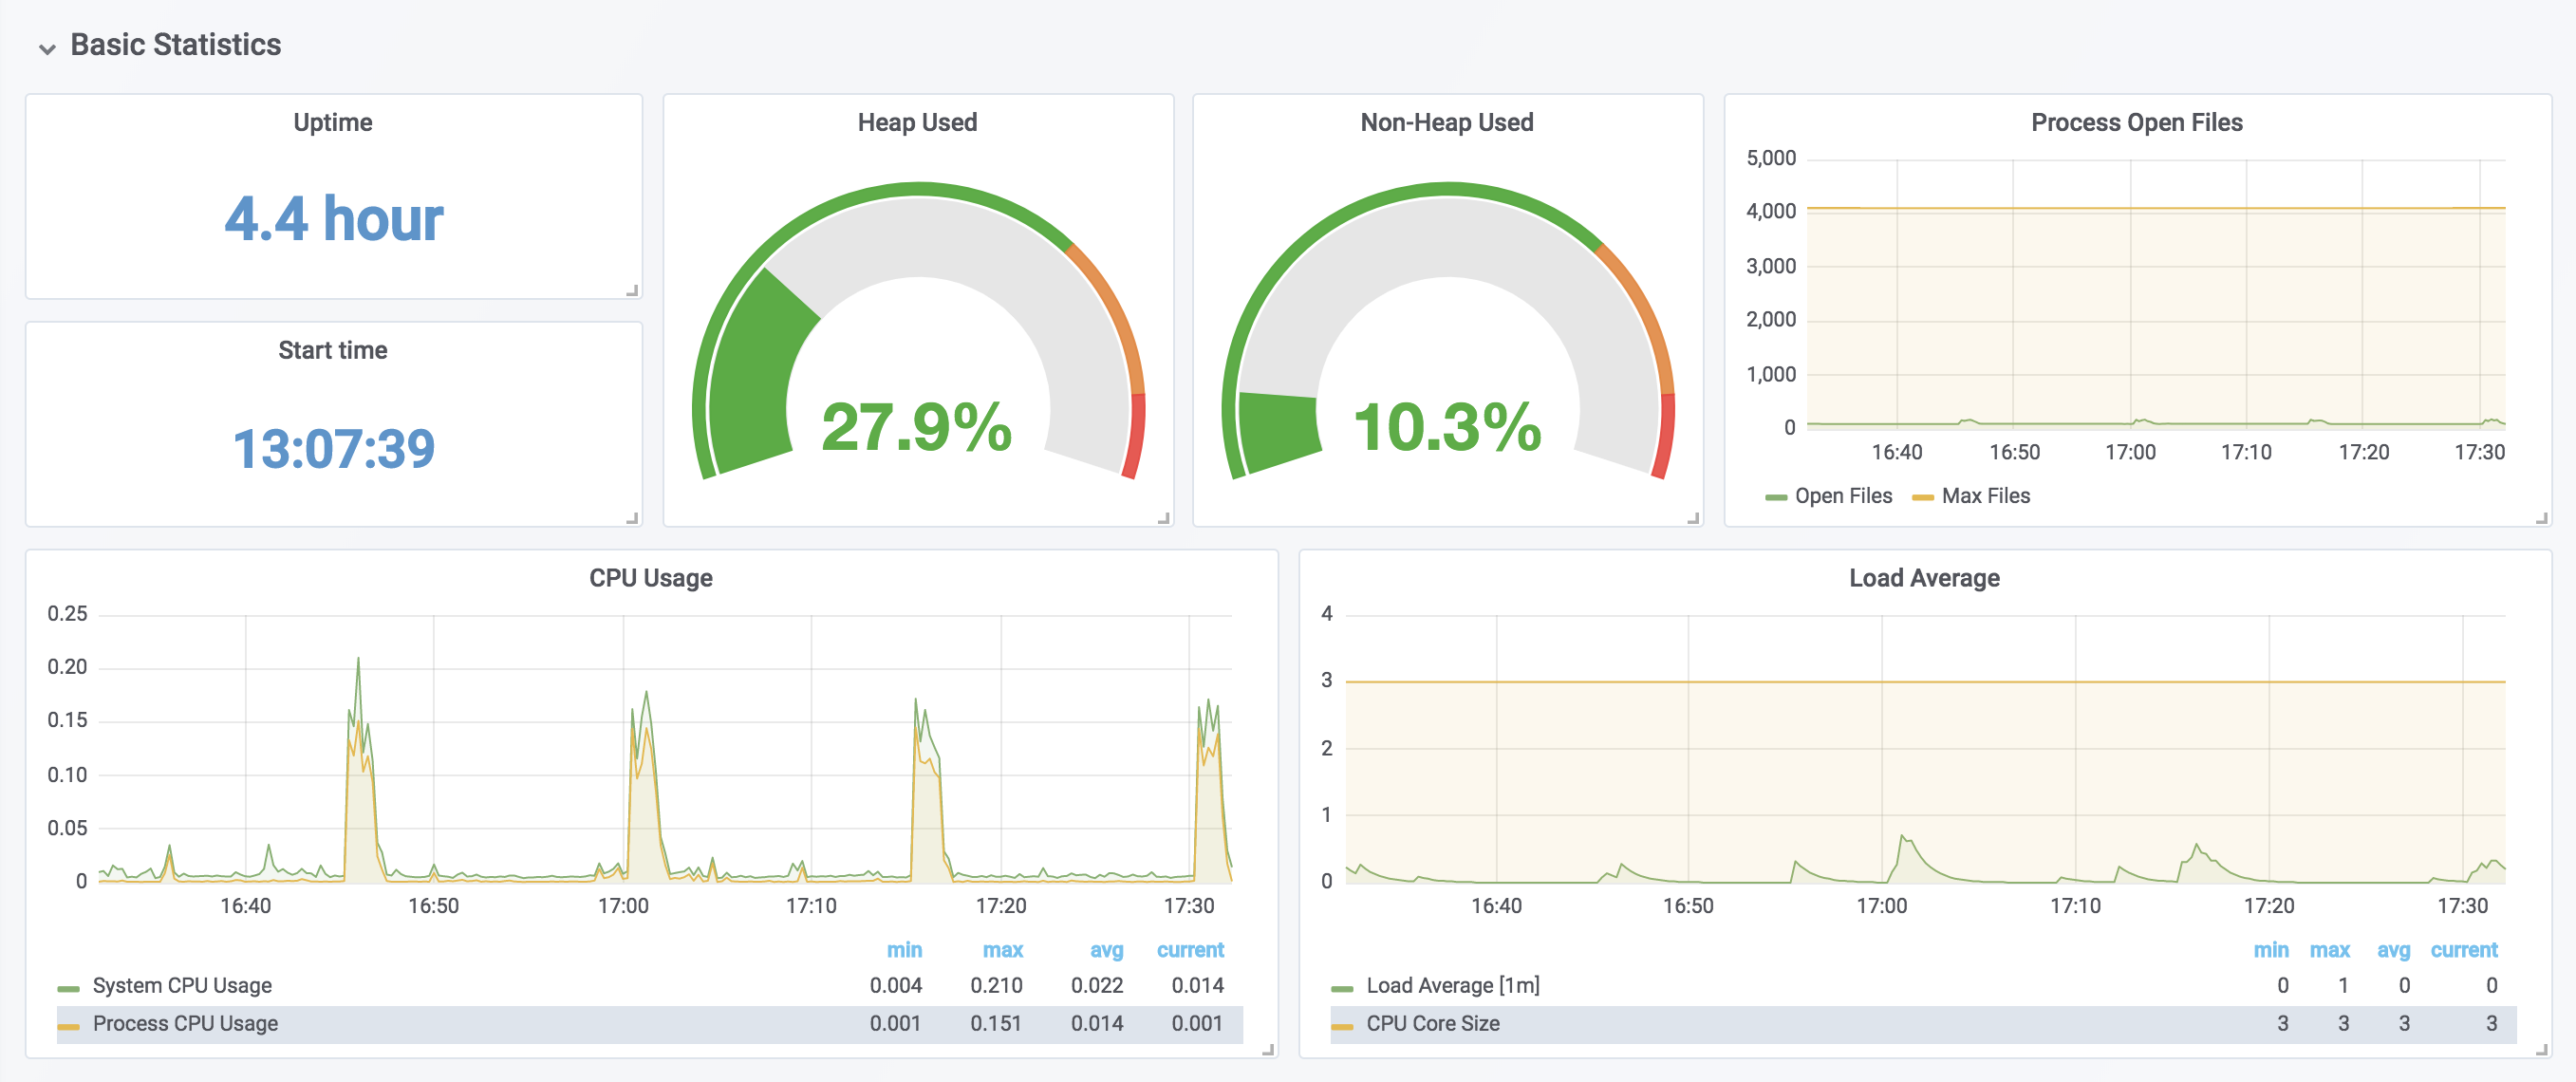
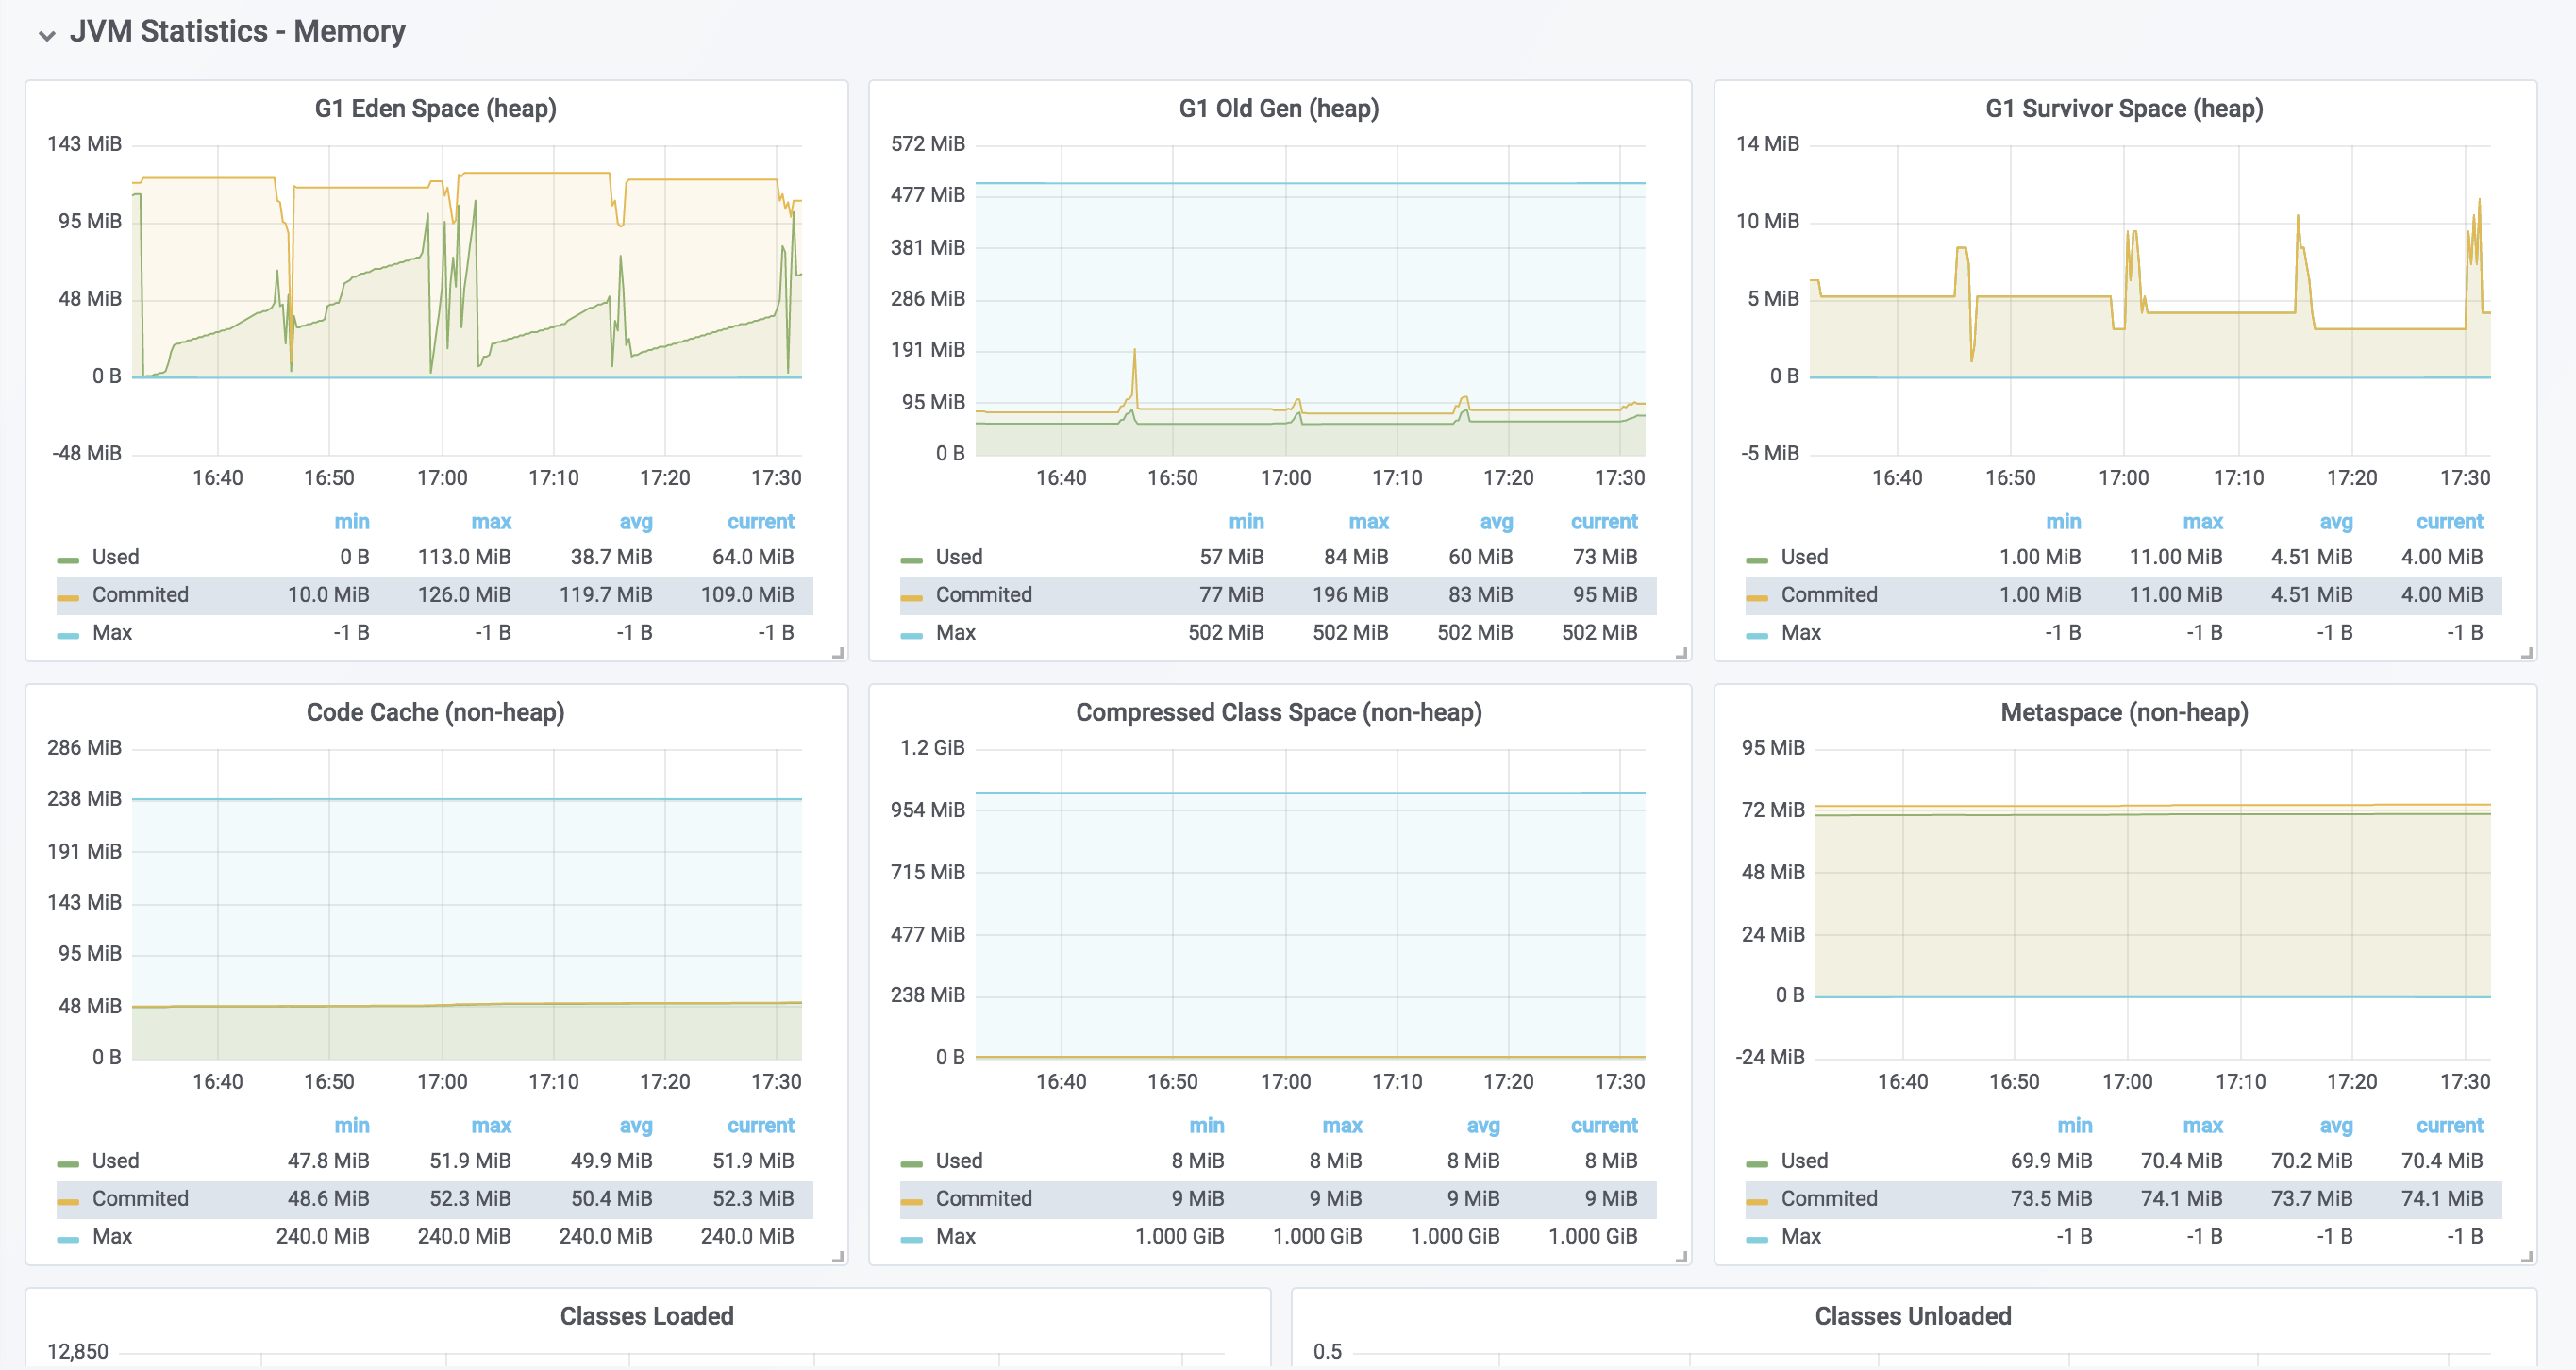
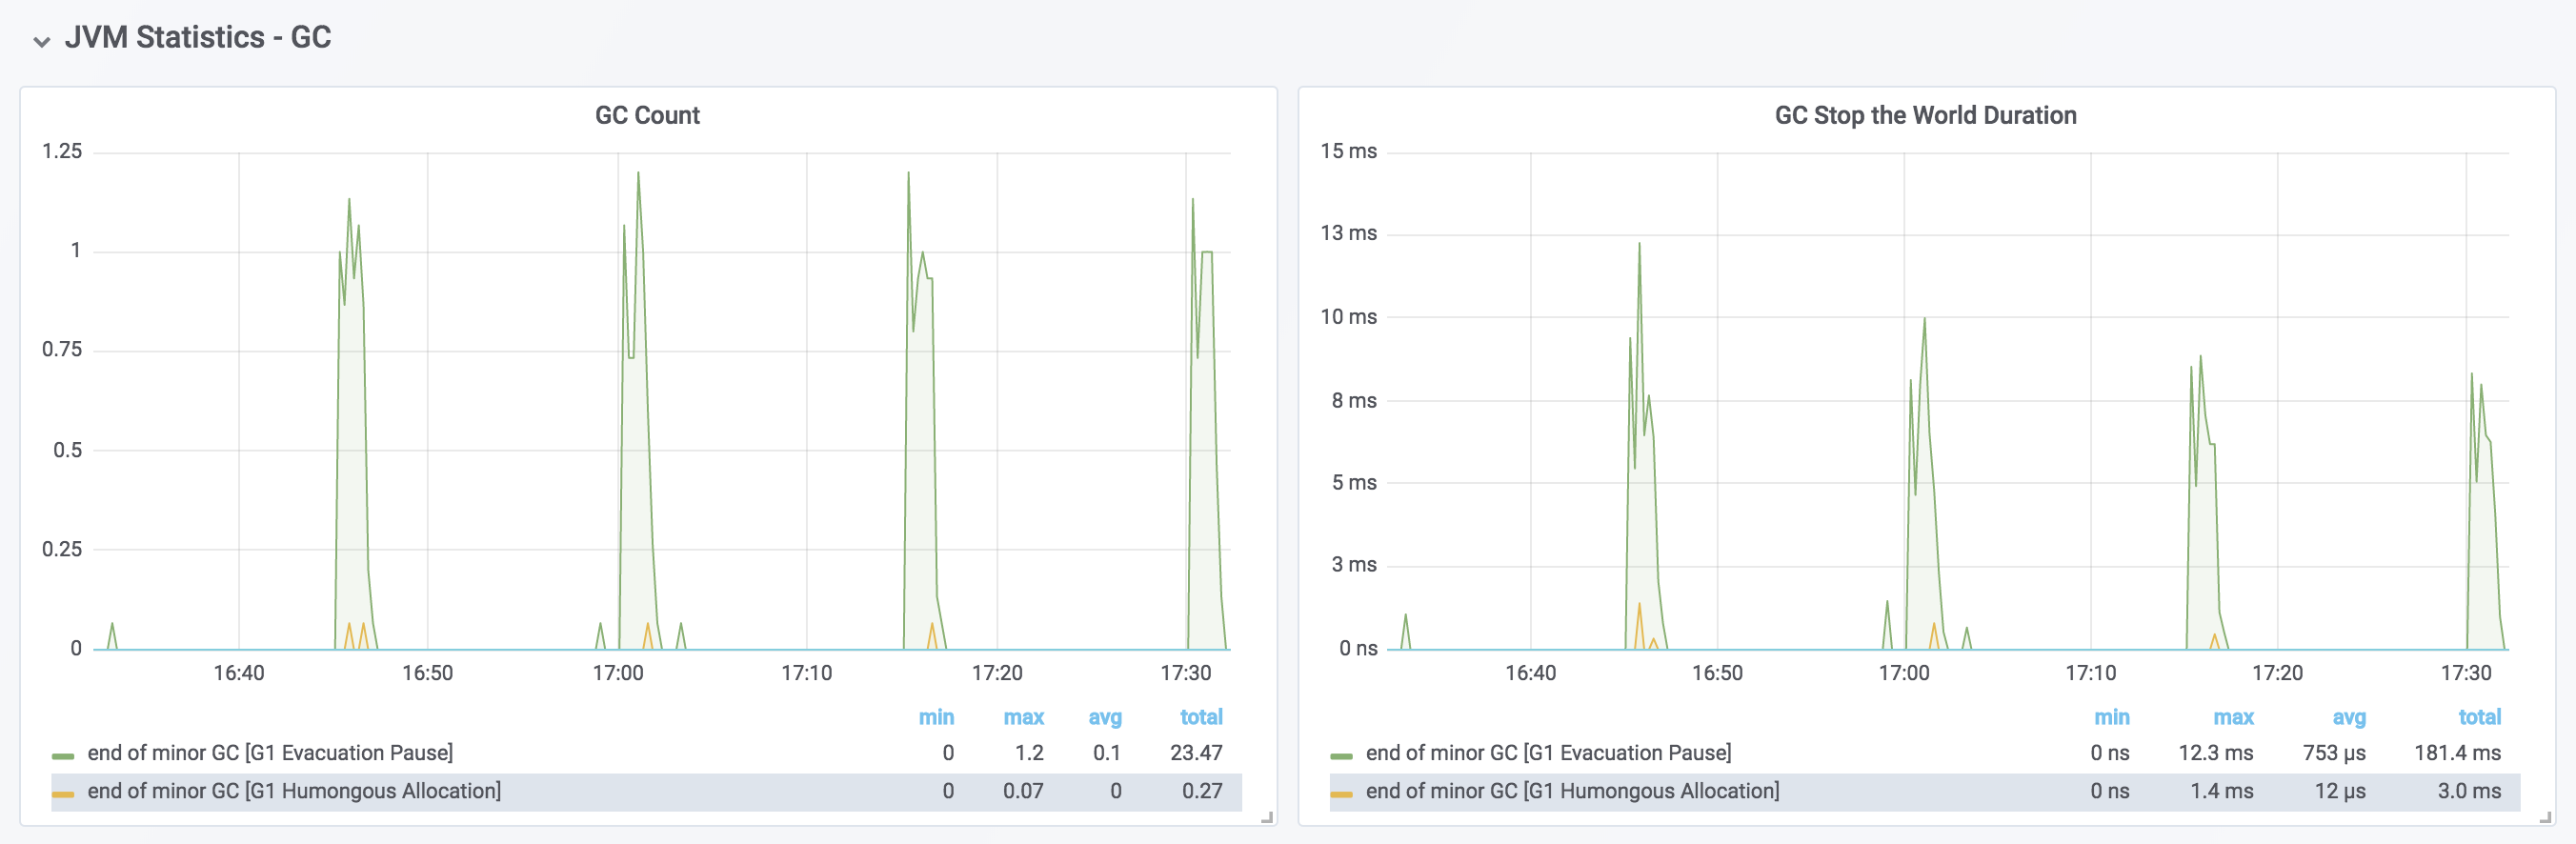
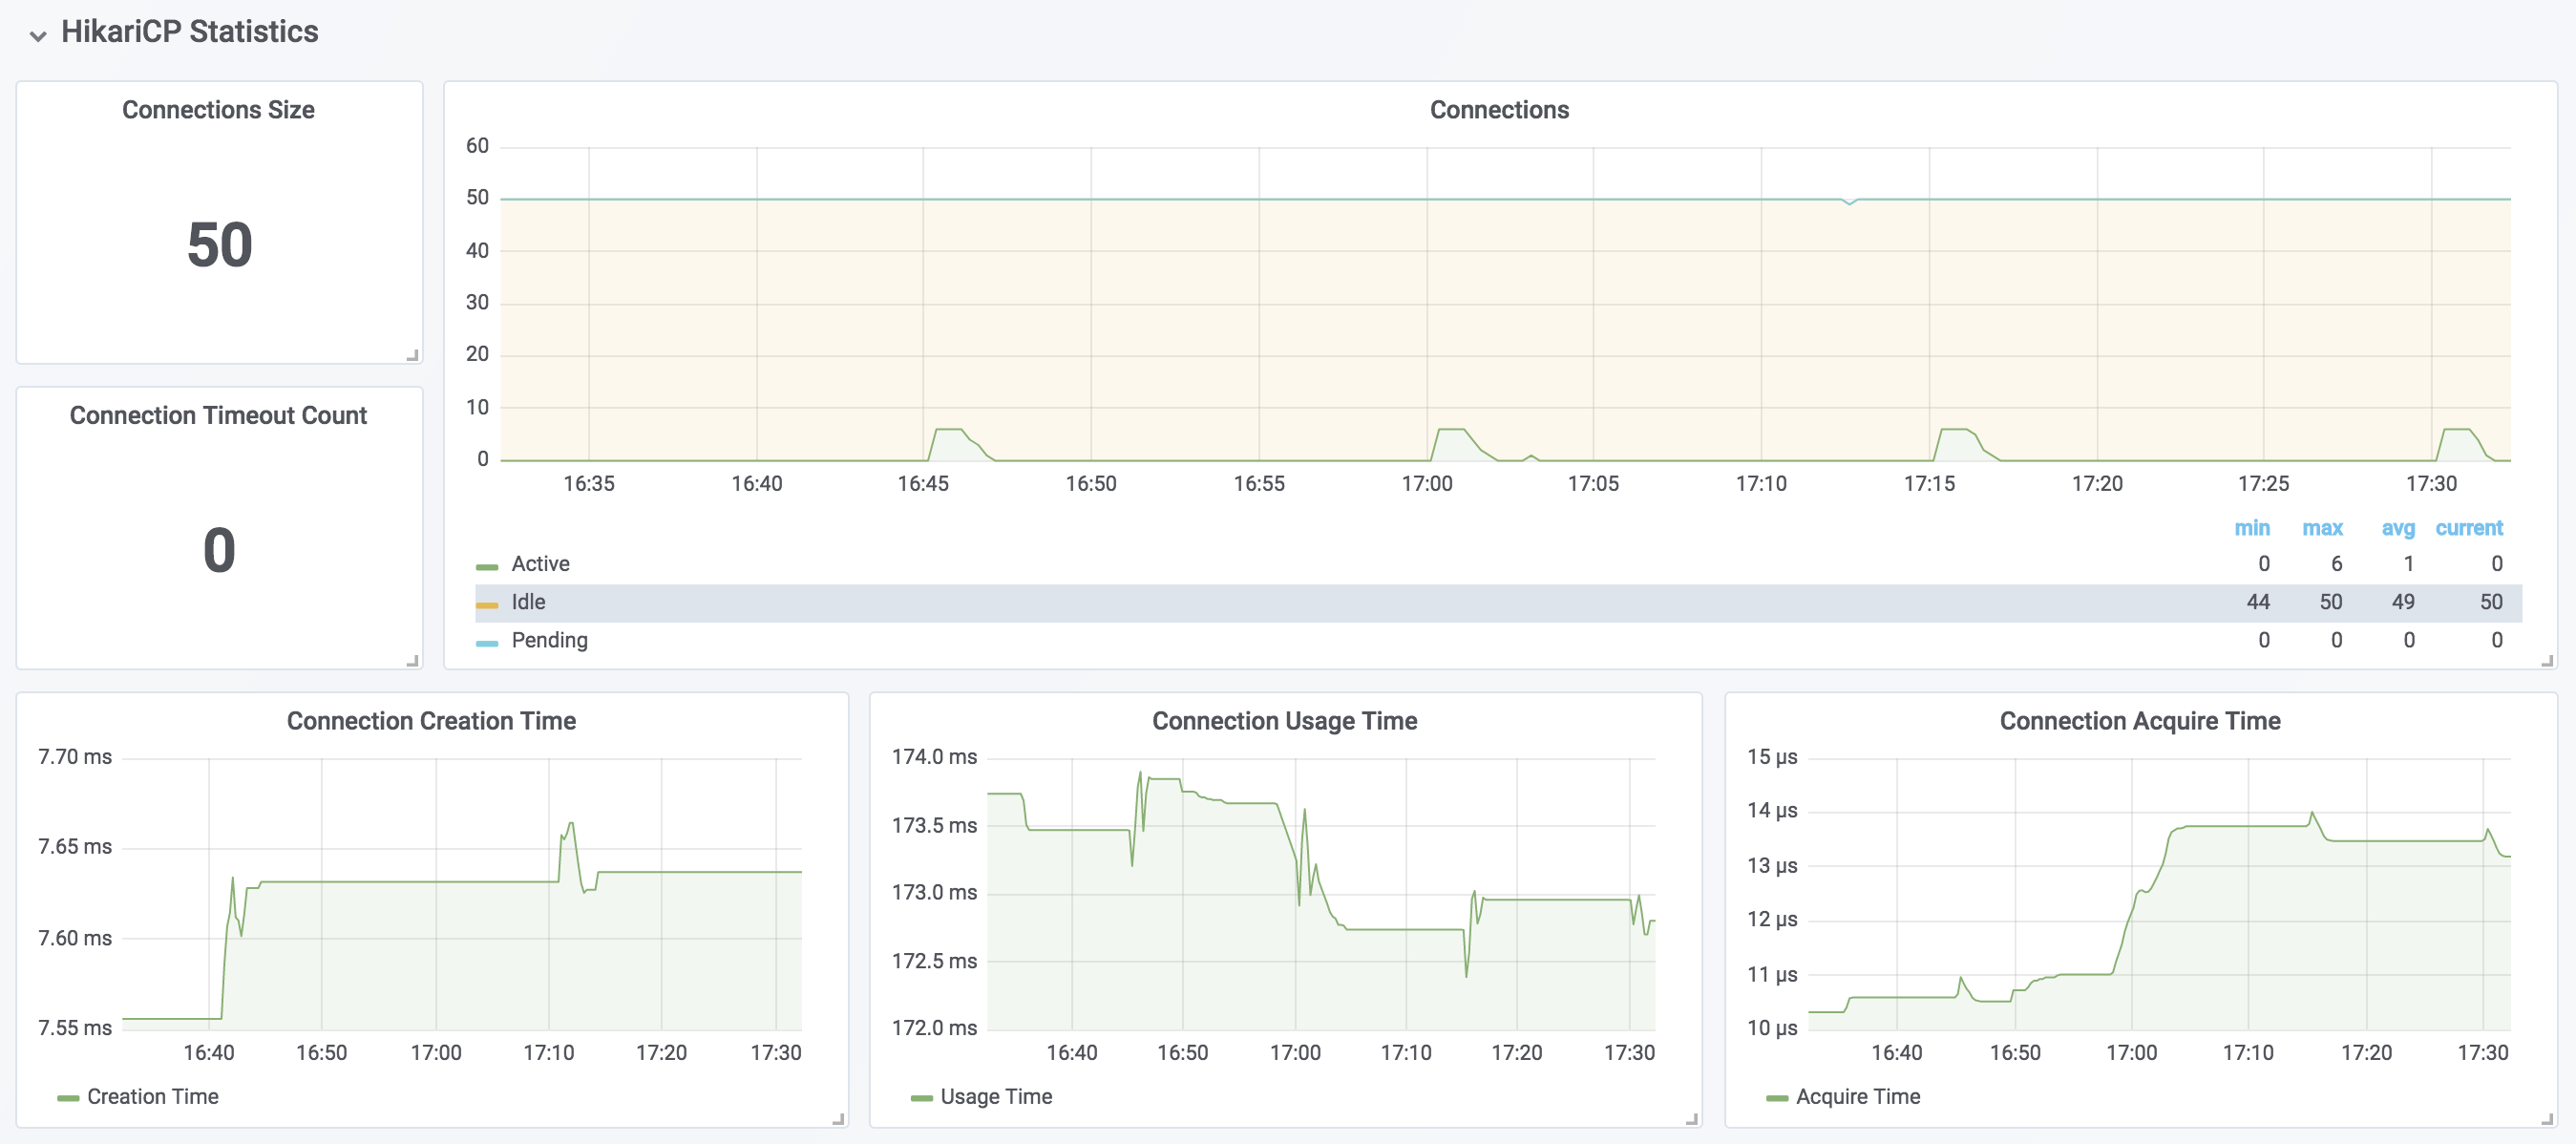
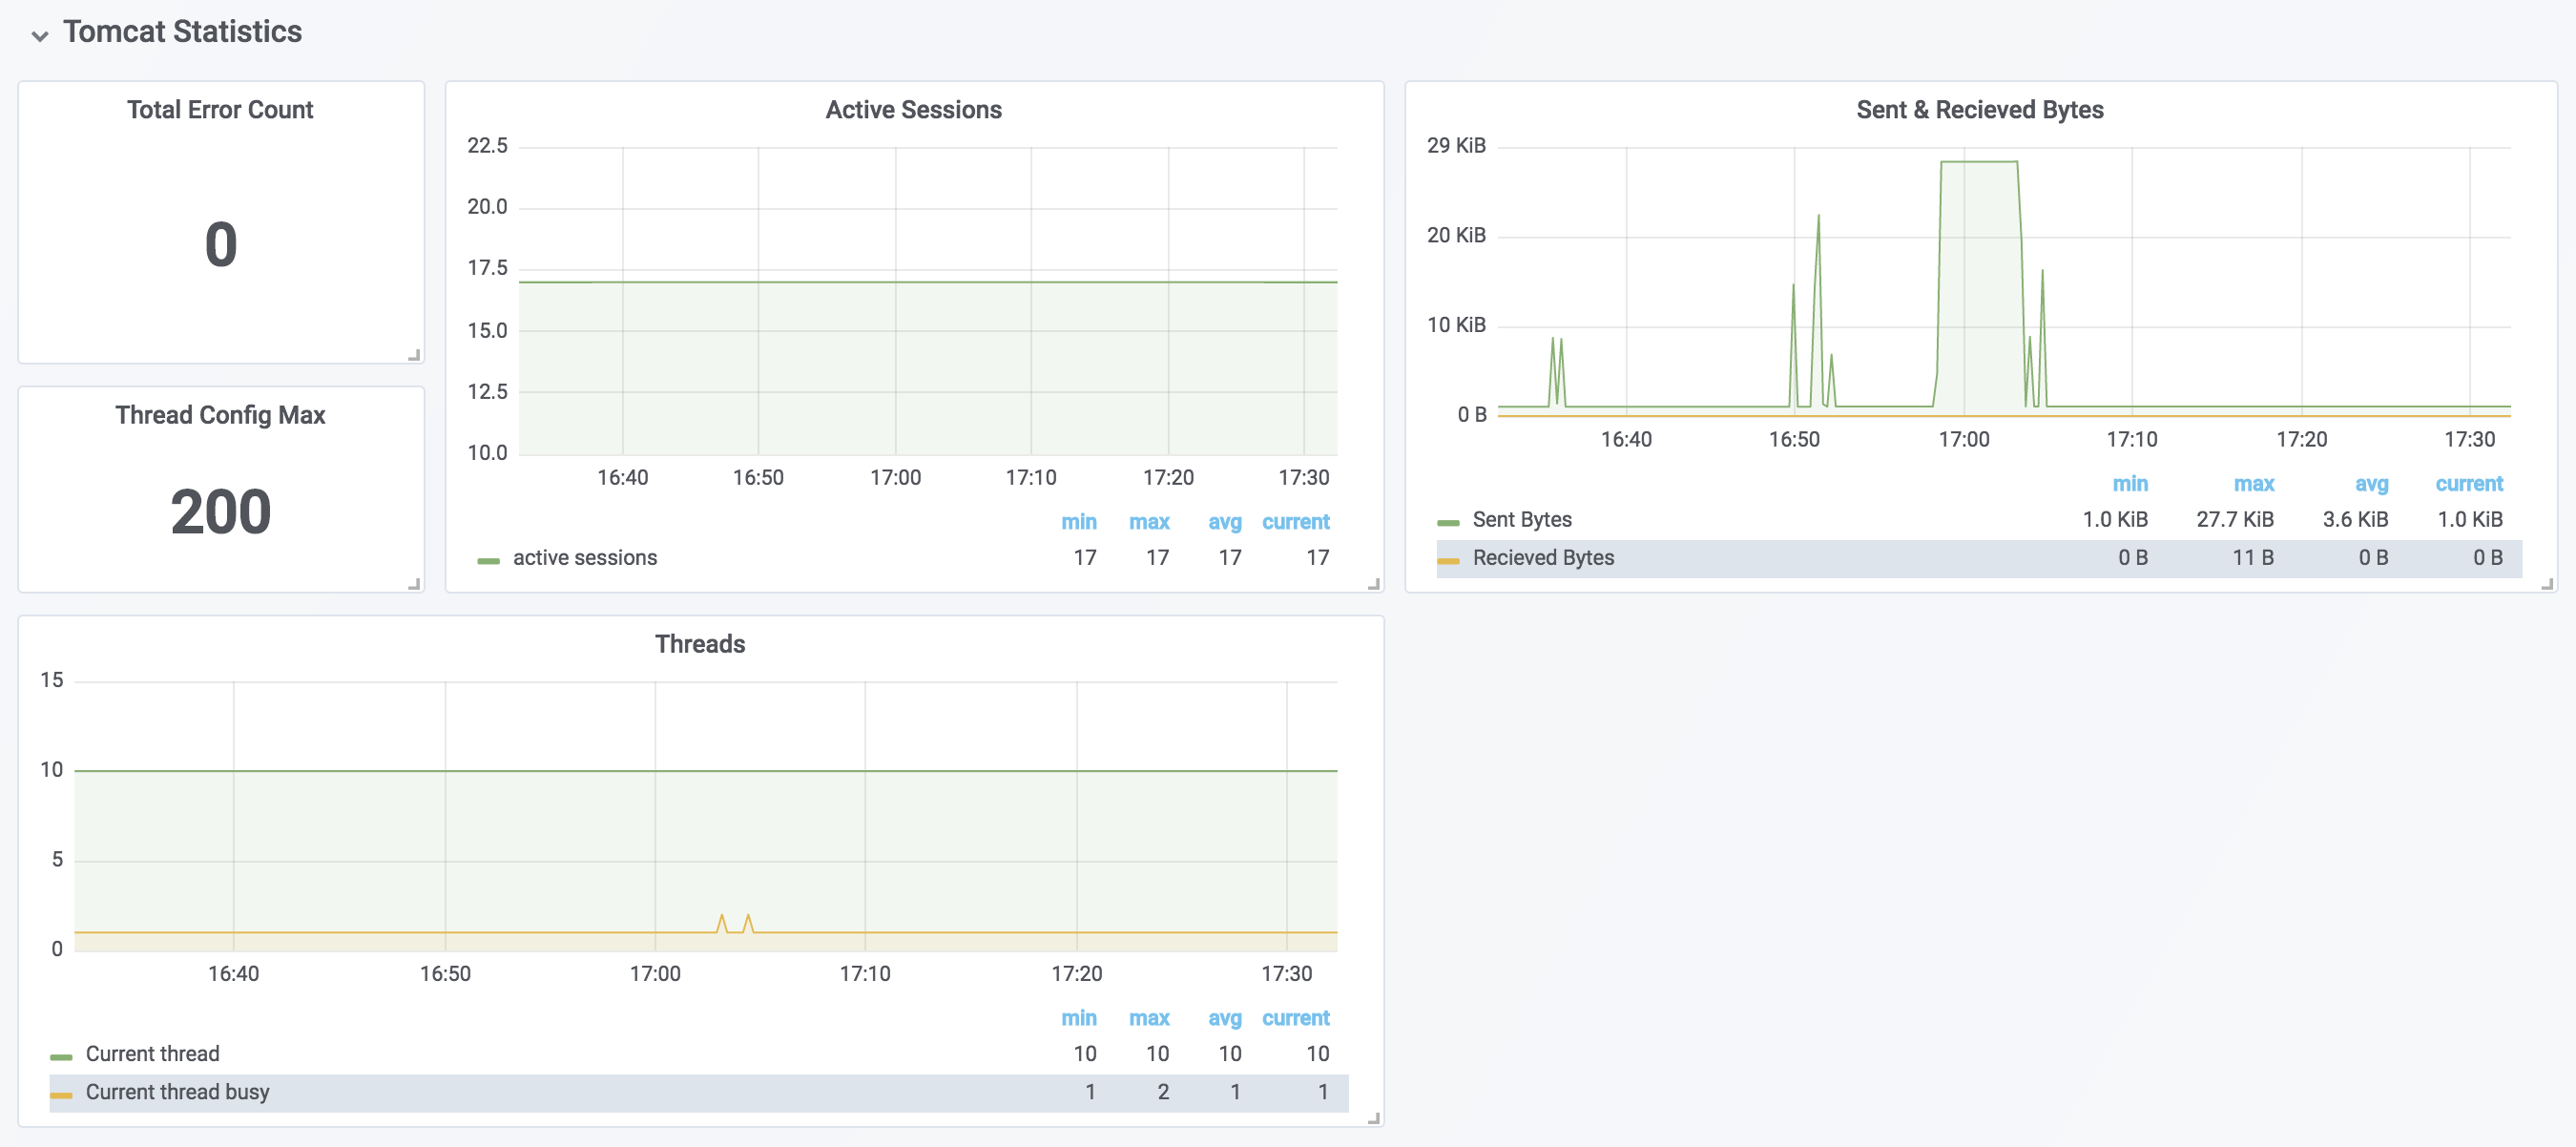
Spring Boot Statistics
Dashboard for Spring Boot2 Statistics(by micrometer-prometheus).
Exporter
This dashboard uses the following exporter metrics.
Variables
This dashboard requires the following Variables.
- $instance - Instance Name
- $application - Spring Boot Application Name
- $hikaricp - HikariCP Connection Pool Name
$application should be marked with prometheus.yml label or with Spring bean(See below).
@Bean
MeterRegistryCustomizer<MeterRegistry> metricsCommonTags() {
  return registry -> registry.config().commonTags("application", "MYAPPNAME");
}Data source config
Collector type:
Collector plugins:
Collector config:
Revisions
Upload an updated version of an exported dashboard.json file from Grafana
| Revision | Description | Created | |
|---|---|---|---|
| Download |
Spring Boot
Easily monitor Spring Boot with Grafana Cloud's out-of-the-box monitoring solution.
Learn moreGet this dashboard
Import the dashboard template
or
ID