
Internal Grafana Stats (Elasticsearch)
Data Proxy request timings (percentiles), dashboard loads, logins etc, Elasticsearch version.
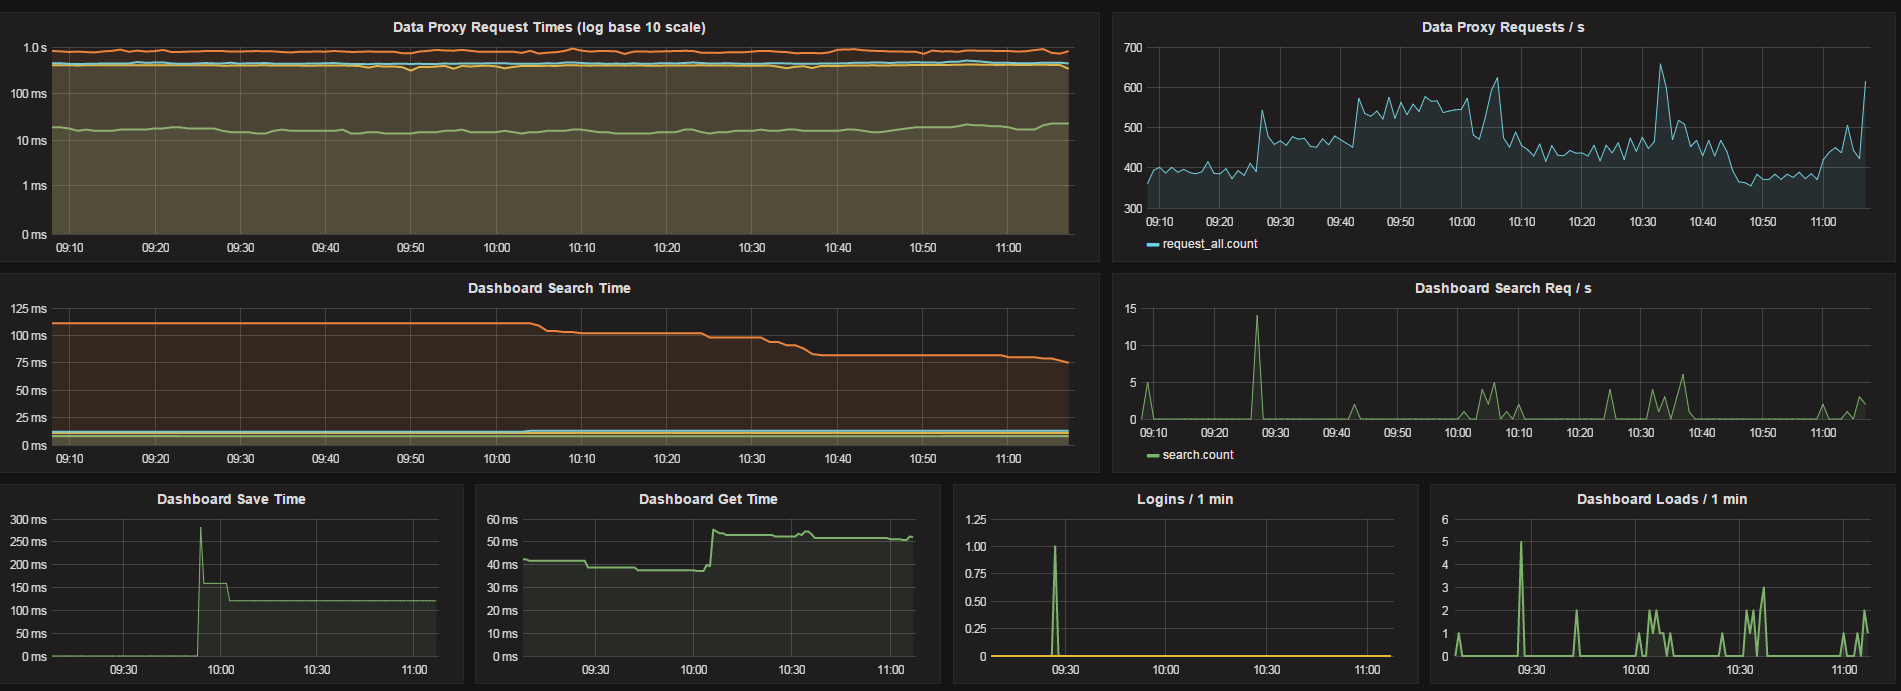
Modified version of the original (graphite) to work with Elasticsearch.
The below powershell script, will collect the metrics from the grafana API based on the interval set and publish the data to Elasticsearch.
Update:
[string[]]$grafanaServers = "localhost:3000"
$interval = 60
$elasticServer = "server1:9200"
Download Powershell script (requires PS version 3+) from:
https://github.com/trevorndodds/Powershell-grafana-scripts/blob/master/Grafana/grafana2elastic.ps1
Run it as a windows service using nssm - https://nssm.cc
Data source config
Collector type:
Collector plugins:
Collector config:
Dashboard revisions
Upload an updated version of an exported dashboard.json file from Grafana
| Revision | Decscription | Created | |
|---|---|---|---|
| Download |
Sign up for Grafana Cloud

Get up and running in minutes with the Grafana Cloud free tier, which includes free forever 10k metrics, 50GB logs, 50GB traces, 500 VUh, and more.
Get this dashboard
Data source:
Dependencies: