Kubernetes Pods (Prometheus)
A dashboard to view pod metrics by namespace and pod names. Use this Helm chart to launch Grafana into a Kubernetes cluster. It will include this dashboard and many more dashboards to give you visibility into the Kubernetes Cluster. (https://github.com/sekka1/cloud-public/tree/master/kubernetes/pods/grafana-helm)
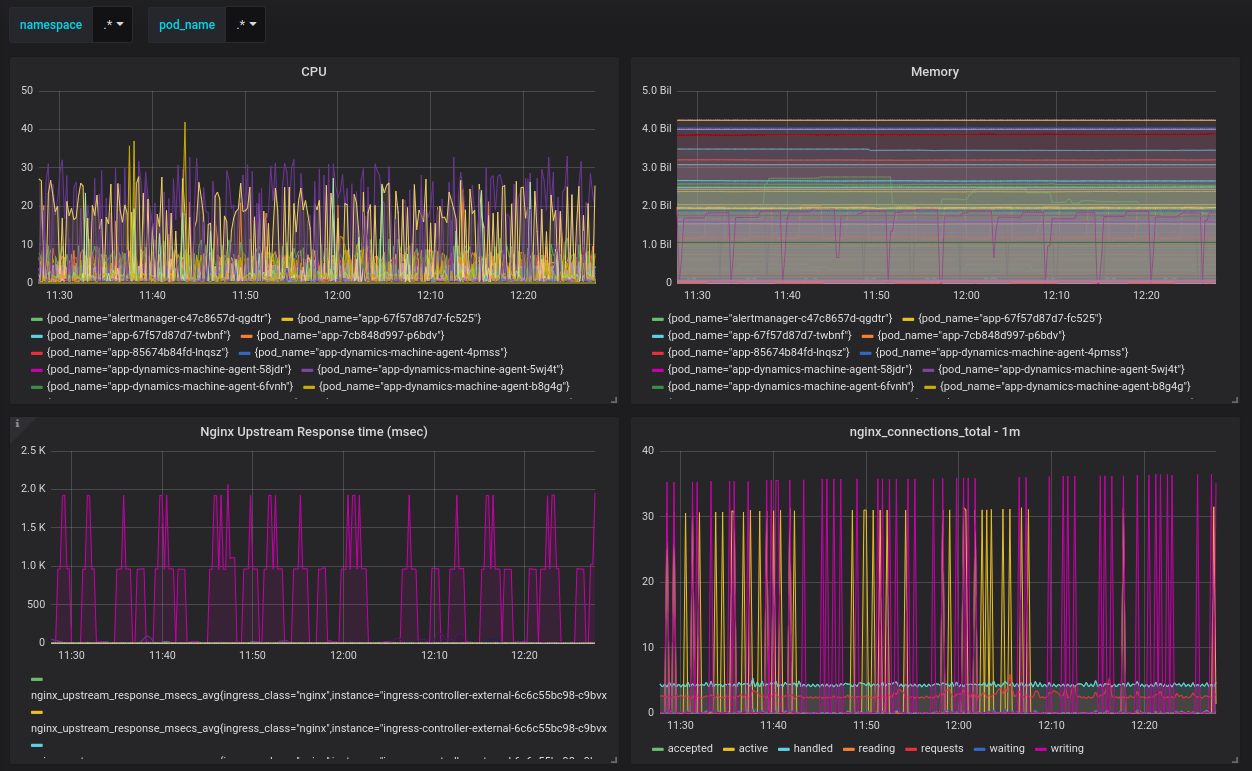
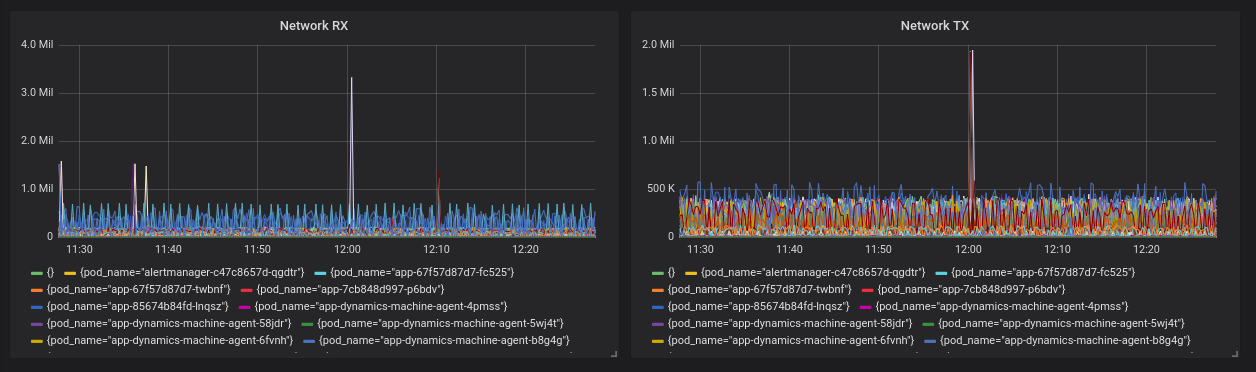
This dashboard will let you select the namespace and pod name or by regex/wildcard and display key metrics for the Kubernetes Pods.
Source repository: https://github.com/sekka1/cloud-public/tree/master/kubernetes/grafana-dashboards/kubernetes-pods
Use this Helm chart to launch Grafana into a Kubernetes cluster. It will include this dashboard and many more dashboards to give you visibility into the Kubernetes Cluster. (https://github.com/sekka1/cloud-public/tree/master/kubernetes/pods/grafana-helm)
Data source config
Collector config:
Upload an updated version of an exported dashboard.json file from Grafana
| Revision | Description | Created | |
|---|---|---|---|
| Download |
Kubernetes
Monitor your Kubernetes deployment with prebuilt visualizations that allow you to drill down from a high-level cluster overview to pod-specific details in minutes.
Learn more