
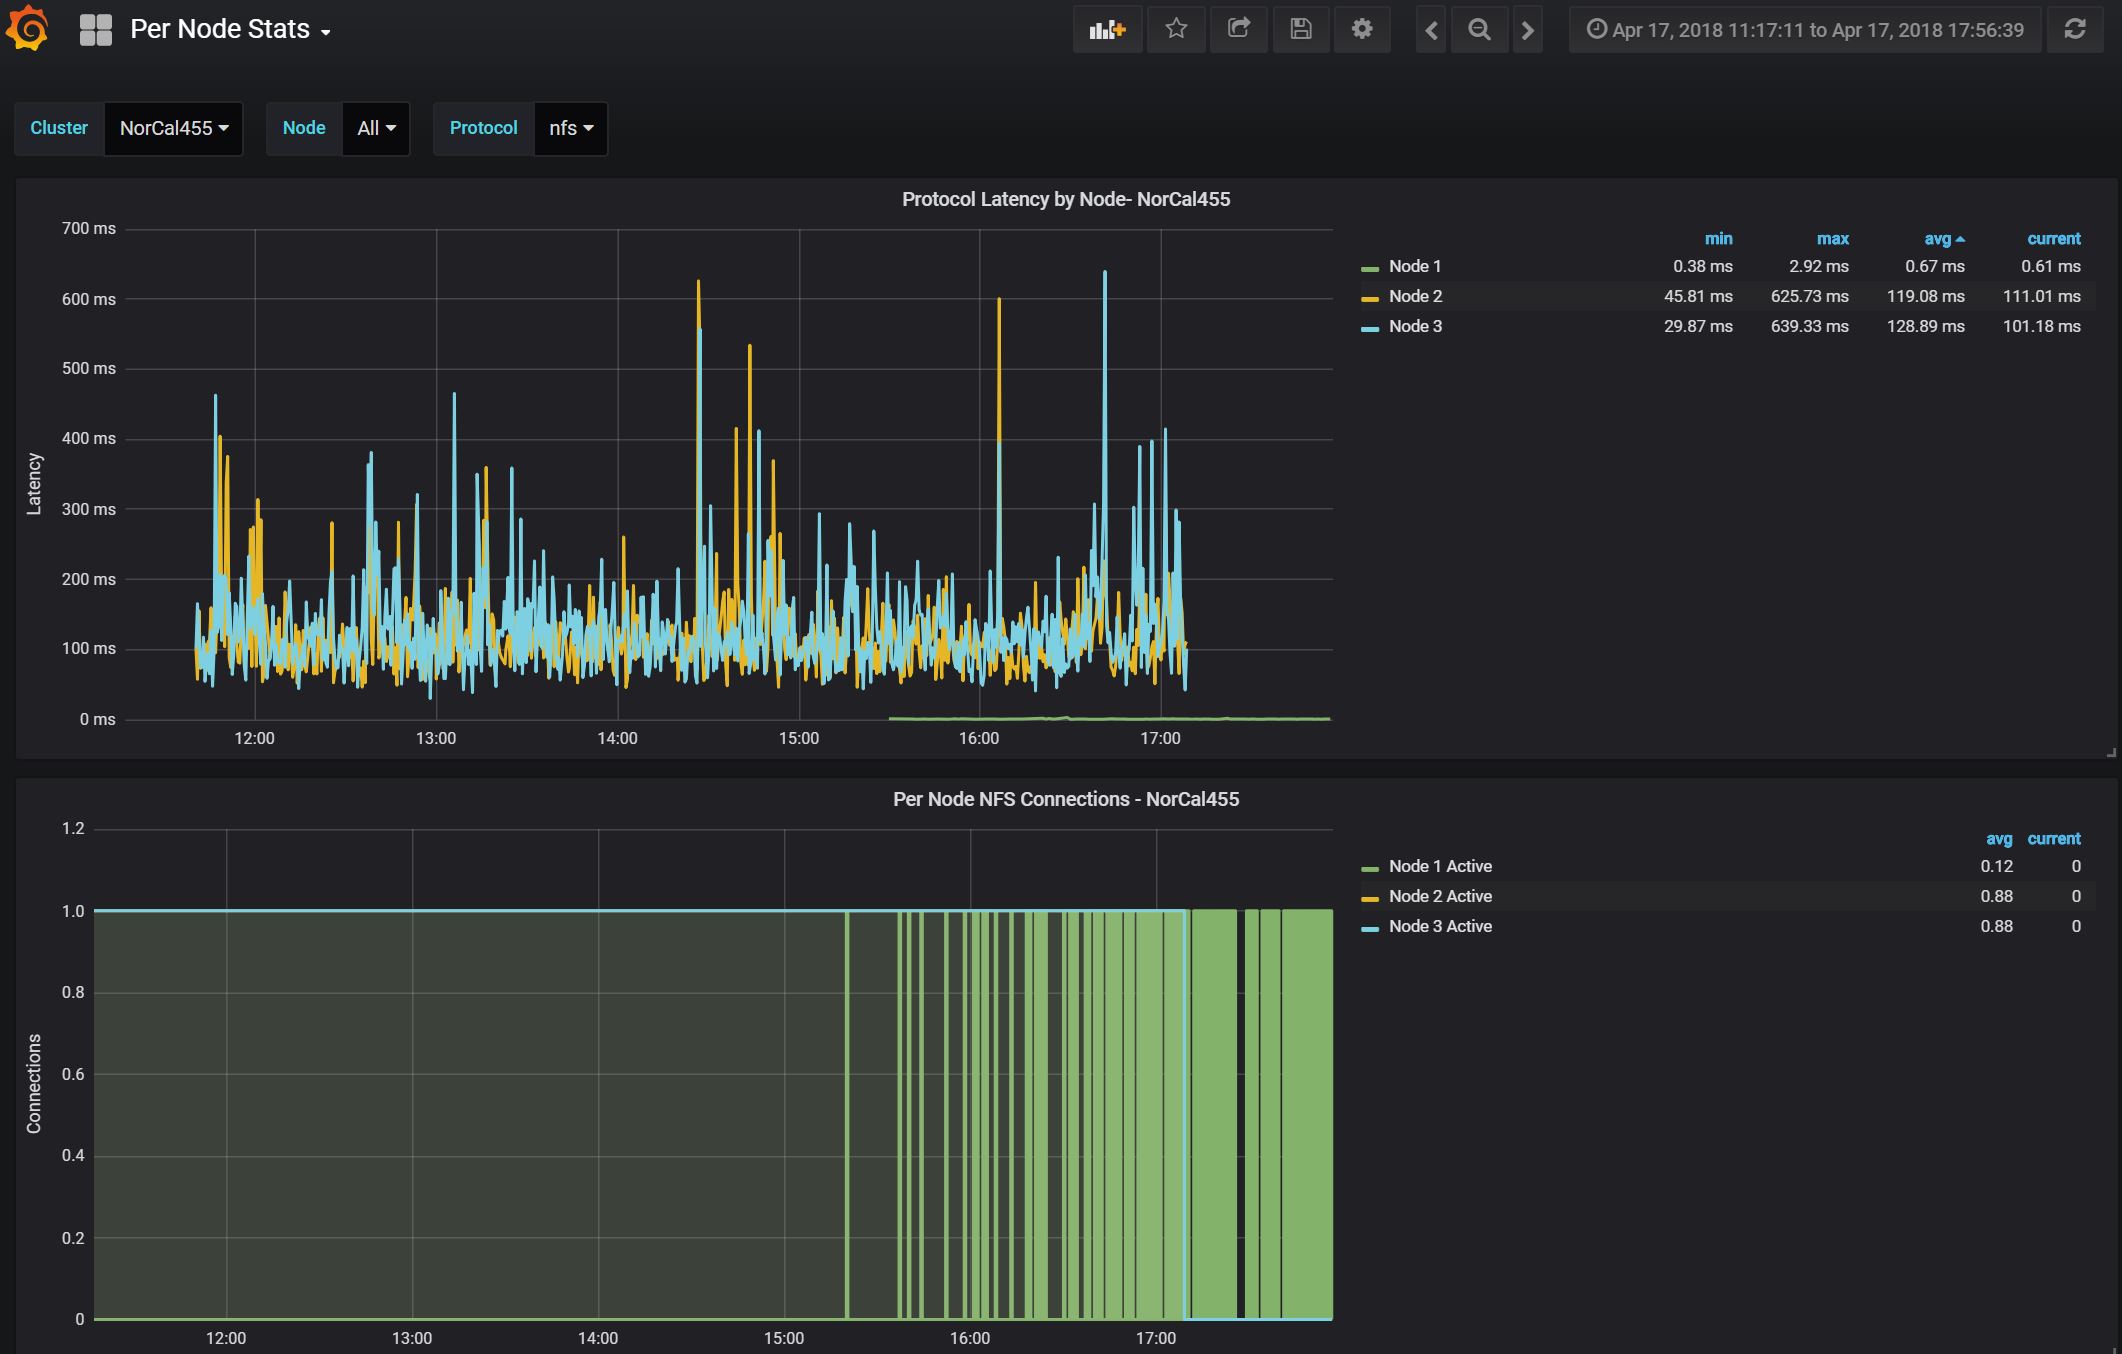
Isilon Per Node SMB/NFS Stats
Dashboard gives per node SMB2 or NFS protocol and per node CPU metrics.
In order for this dashboard to function properly two changes are required within the Isilon Data Insights Connector environment -
- Stop the collector daemon process then edit the isi_data_insights_d.cfg file - adding a node specific stat group and their corresponding keys - Add to active_stat_groups: node_proto_stats node_cpu_stats
Then create the corresponding keys within the new stat group: [node_proto_stats] update_interval: * stats: node.protostats.nfs node.protostats.smb2
[node_cpu_stats] update_interval: * stats: node.cpu.sys.avg node.cpu.user.avg node.cpu.idle.avg node.cpu.intr.avg
Then restart the service, which will begin collecting data points for these statistic keys.
- Create 3 variables within the Grafana dashboard, once imported, in order to filter the queries to display the metrics properly.
- Cluster variable - show tag values with key = "cluster"
- Node variable - show tag values with key = "node" where "cluster" =~ /^$cluster/
- Protocol variable - nfs,smb2
Data source config
Collector config:
Upload an updated version of an exported dashboard.json file from Grafana
| Revision | Description | Created | |
|---|---|---|---|
| Download |
Linux Server
Monitor Linux with Grafana. Easily monitor your Linux deployment with Grafana Cloud's out-of-the-box monitoring solution.
Learn more