Nifi_Metrics
This dashboard is used to monitor the metrics related to NiFi
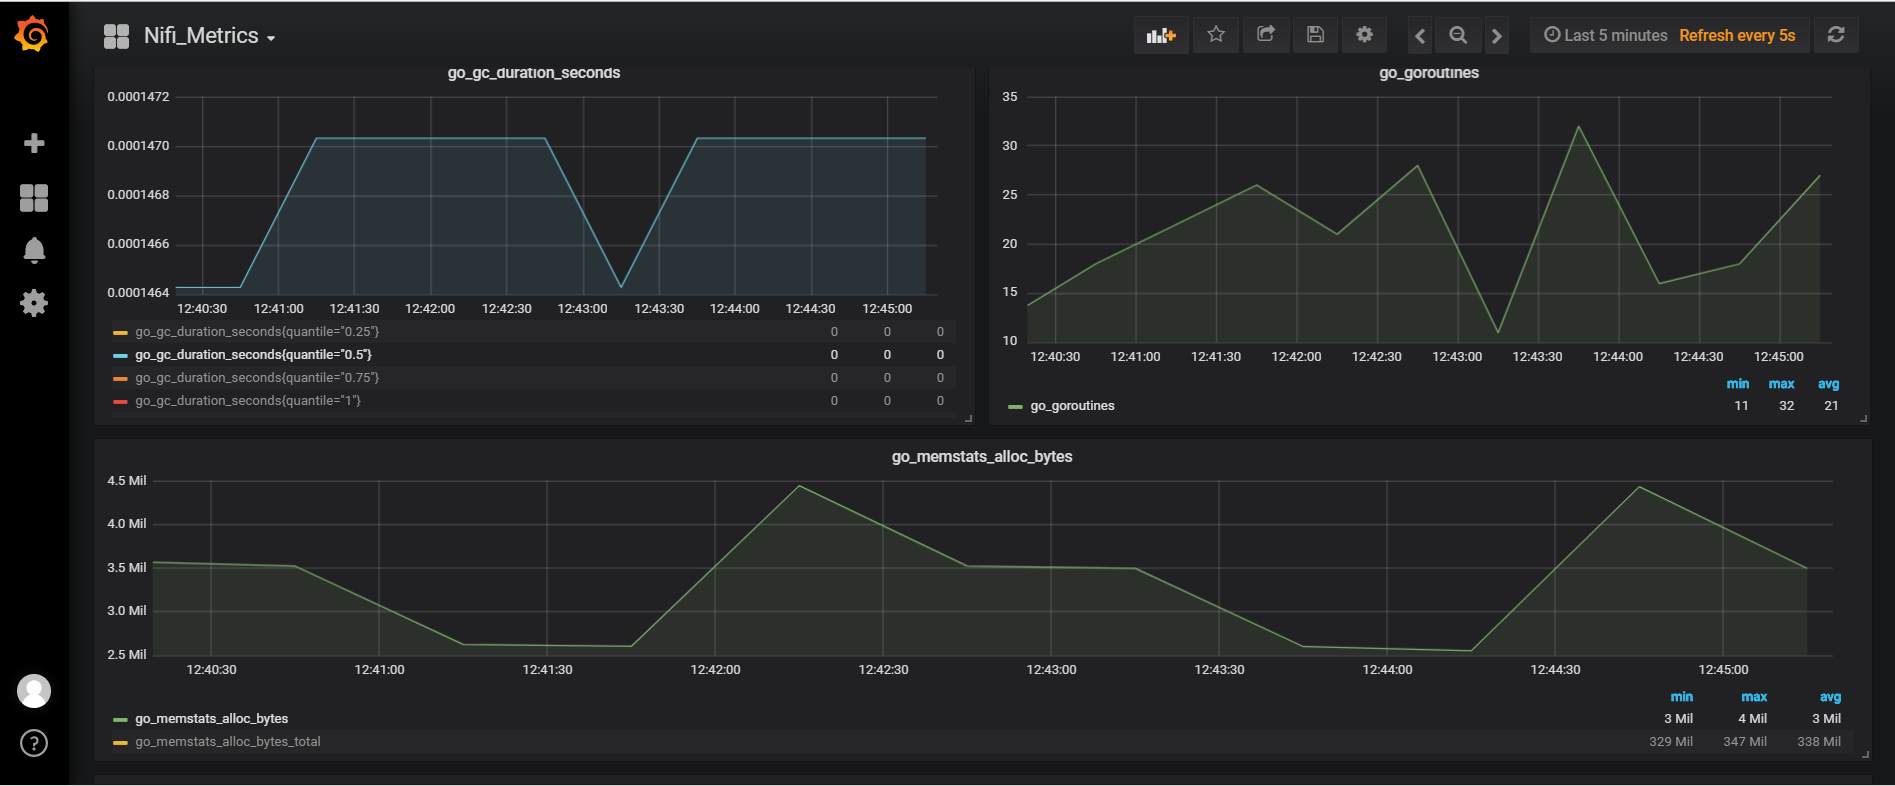
This dashboard is used to monitor the metrics related to NiFi. The metrics from NiFi cannot be scraped directly by the Prometheus, rather we make use of PushGateway to which the NiFi sends the metrics data and this data is collected by Prometheus from the Pushgateway.
Data source config
Collector type:
Collector plugins:
Collector config:
Revisions
Upload an updated version of an exported dashboard.json file from Grafana
| Revision | Description | Created | |
|---|---|---|---|
| Download |