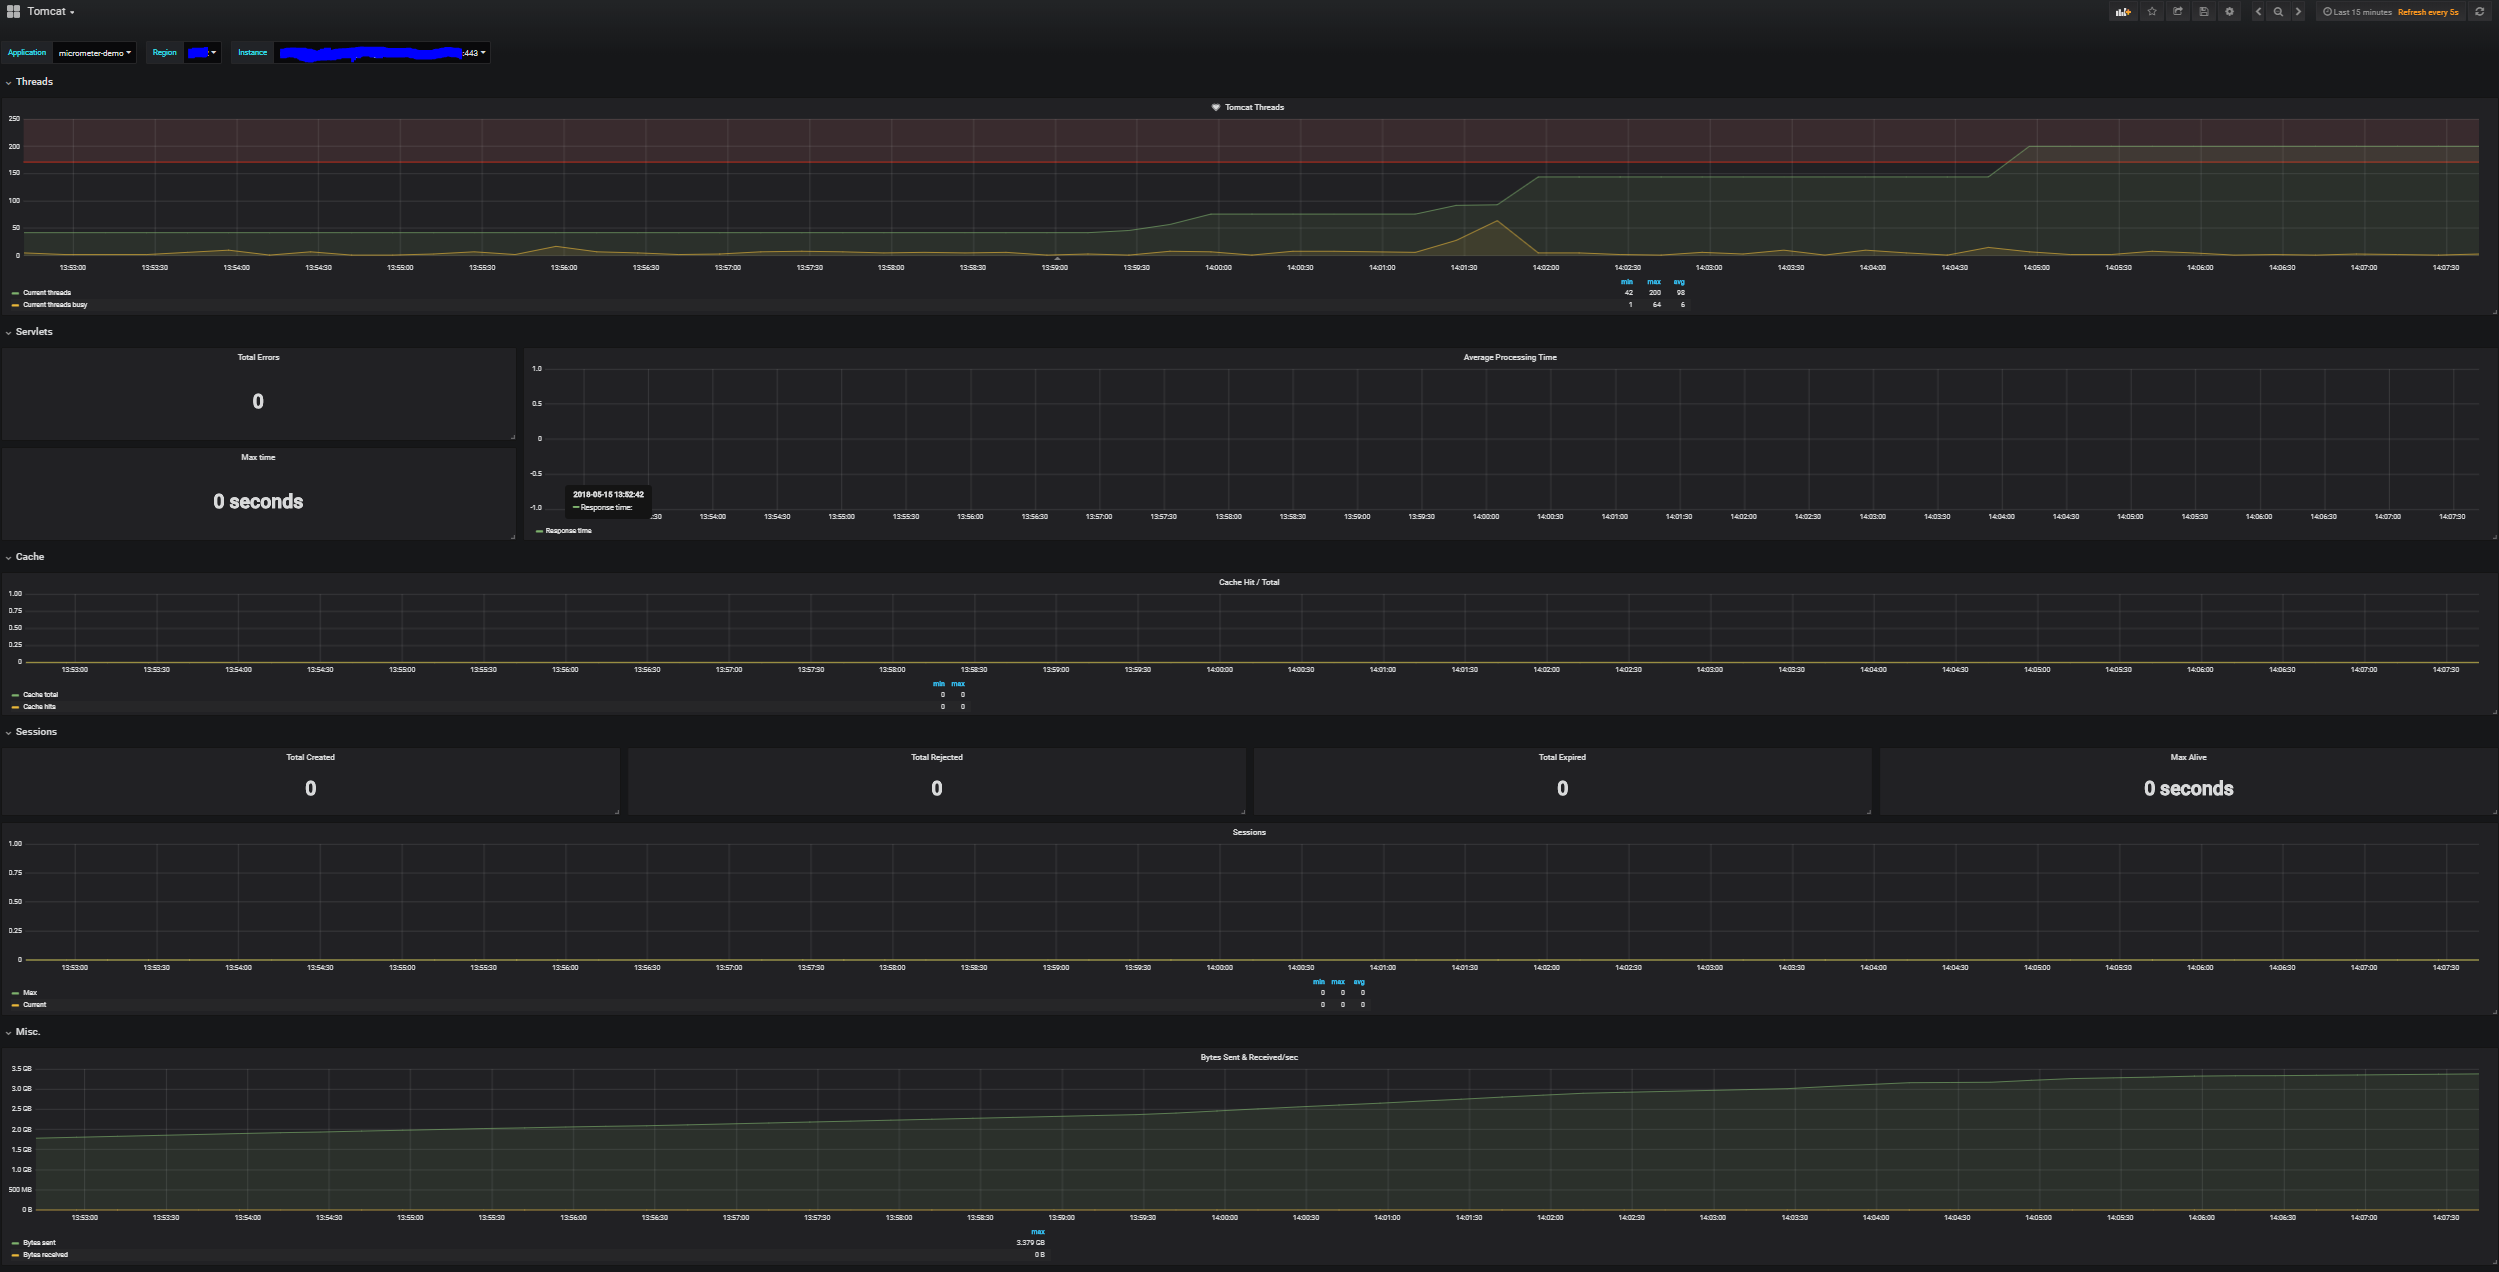
Tomcat
Tomcat Dashboard (Micrometer.io)
Tomcat dashboard will display the metrics from micrometer. You can setup the application name and the region in your Spring Boot app with the config:
@Bean
MeterRegistryCustomizer<MeterRegistry> metricsCommonTags() {
    return registry -> registry.config()
            .commonTags(
                    "application", applicationName,
                    "region", regionName);
}
The application name and region can be provided in your application.properties or environment variables.
The thread alert threshold is set to 170 threads. The default value for tomcat_threads_config_max is 200.
Data source config
Collector config:
Upload an updated version of an exported dashboard.json file from Grafana
| Revision | Description | Created | |
|---|---|---|---|
| Download |
Apache Tomcat
Easily monitor Apache Tomcat, an open source web server and servlet container that can run Java-based web applications, with Grafana Cloud's out-of-the-box monitoring solution.
Learn more
