Docker Swarm & Container Overview
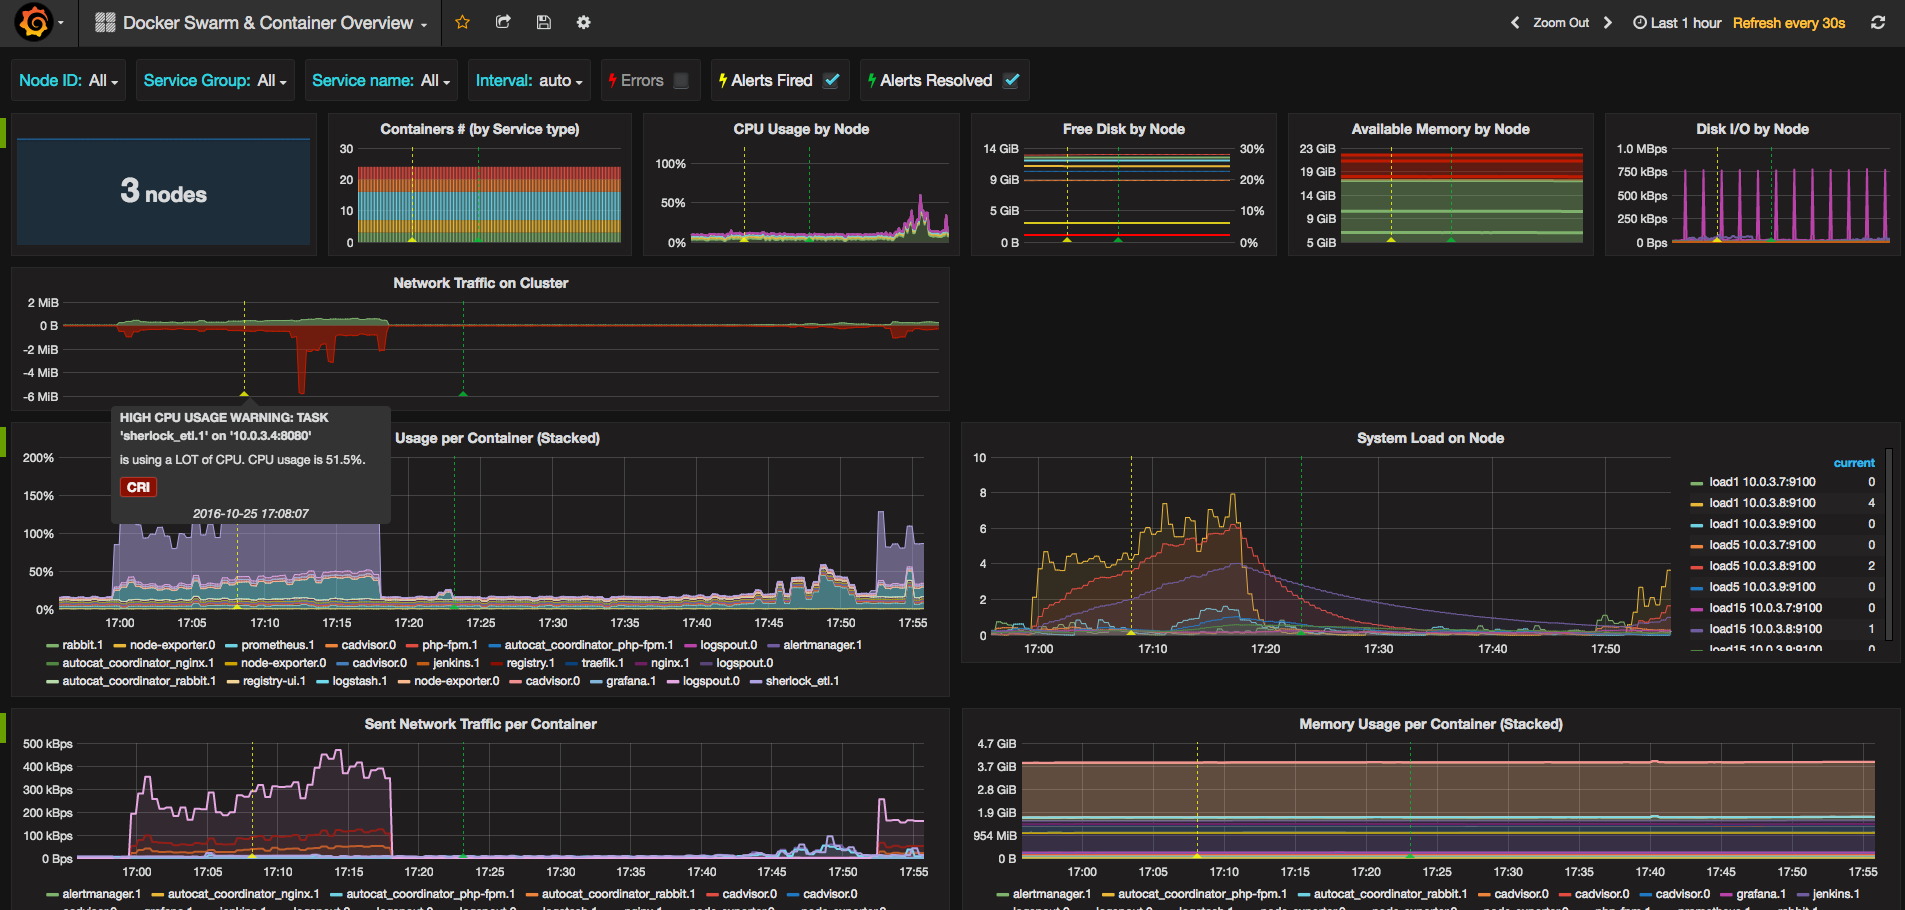
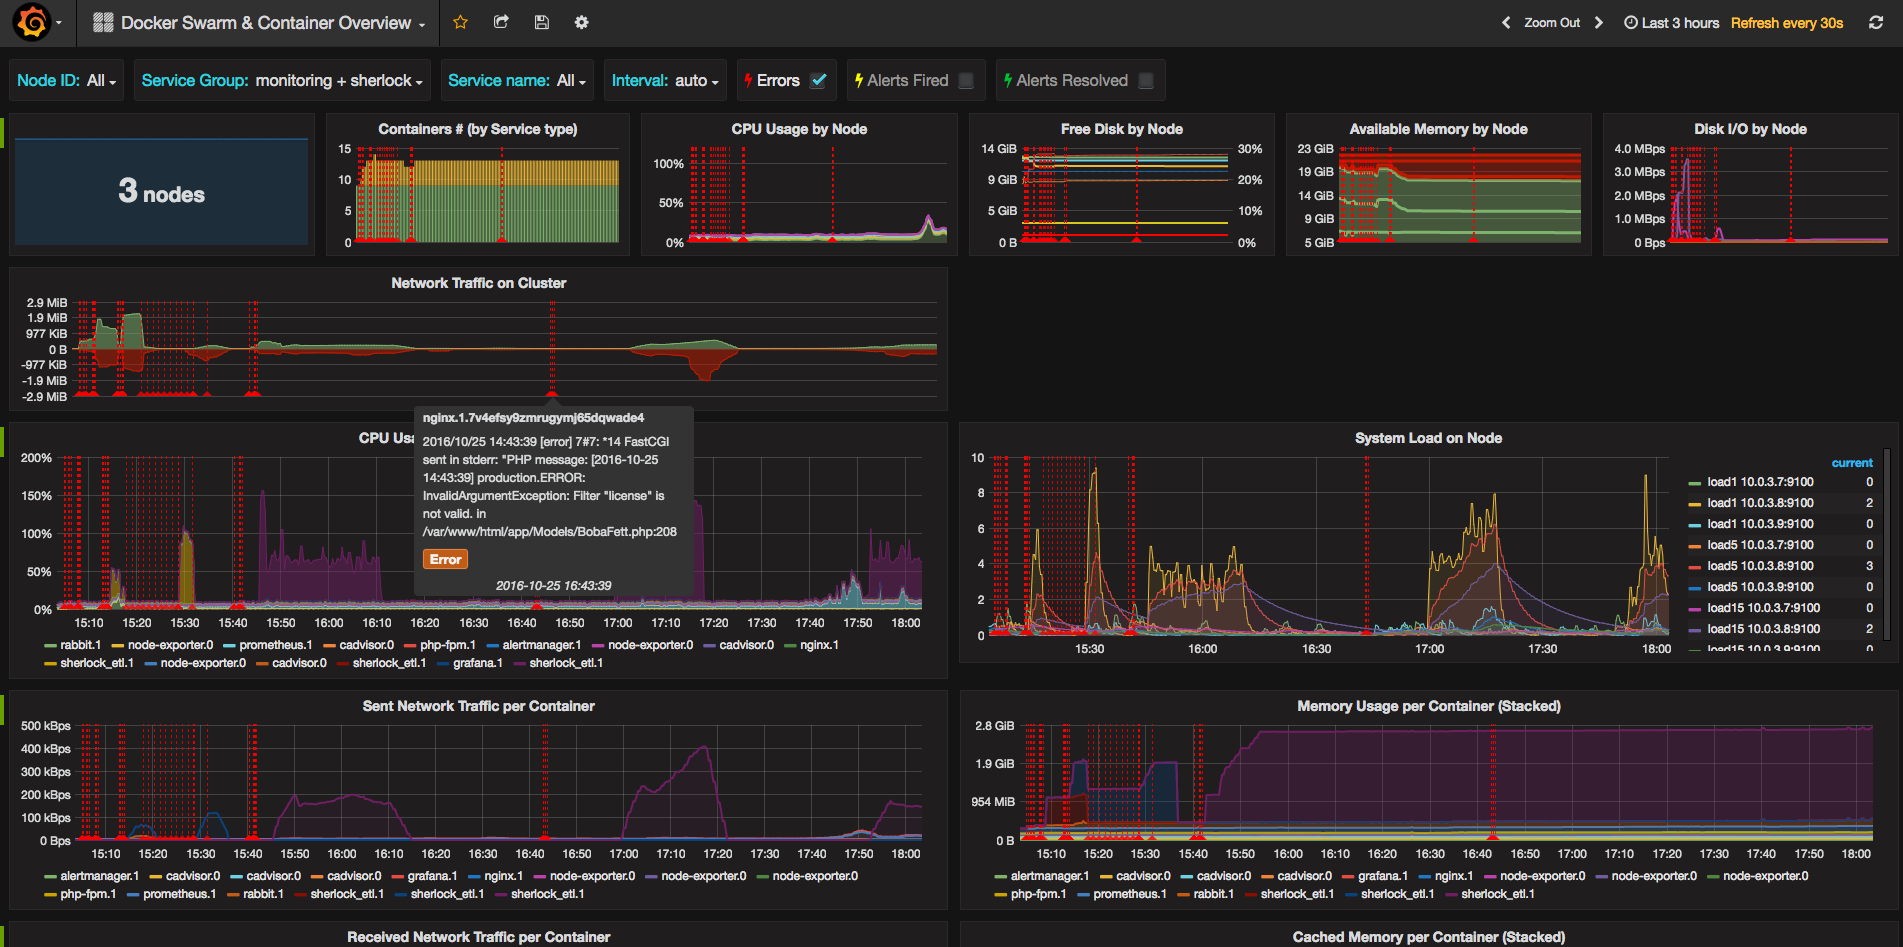
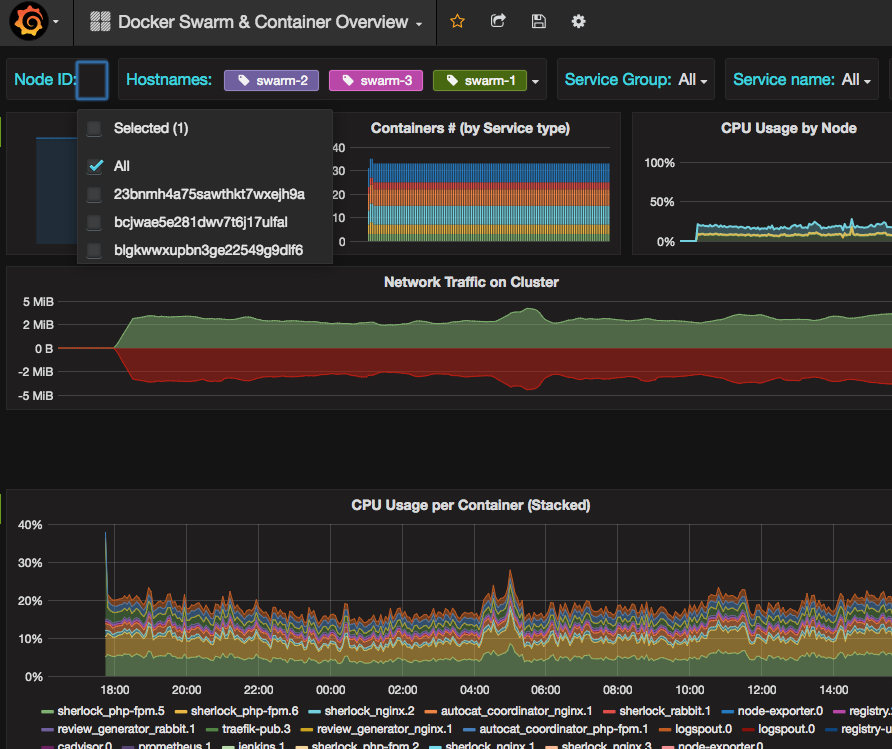
Overview of the most important Docker swarm and container metrics. (cAdvisor/NodeExporter/Prometheus)
It modifies a little bit the original dashboard to adapt the graphs to fit better with a Docker swarm cluster which is running cAdvisor and Node Exporter on each node.
To use it you need:
- A Docker swarm mode cluster.
- Launch some services. Swarm will automatically propagate some labels that are used by the dashboard.
- If you don't launch the services using the "docker stack deploy XXX" command there's another label that you'll need to launch per service (--container-label com.docker.stack.namespace=XXX) to identify those services by its intended usage.
- You'll need to launch cAdvisor and node-exporter as global service in the cluster, and use the same network for them and the Prometheus instance.
- Node exporter can export extra metrics, in this case I found useful to export the hostname, to allow the node metrics to be split by it. An example of this can be found in the repo: https://github.com/bvis/docker-node-exporter
- Prometheus needs to be launched with the auto-discovery configuration based on DNS.
- It uses Elasticsearch to search errors in the logs generated by logstash
- It uses Elasticsearch, in another index, to check for alerts fired and resolved
- It assumes that in your cluster you are using a proxy for public traffic. You can decide from your services list which one is your proxy. I find useful to have split the traffic of this service, because it basically can distort the traffic metrics. This configuration should work:
global:
scrape_interval: 30s
evaluation_interval: 30s
labels:
cluster: swarm
replica: "1"
scrape_configs:
-
job_name: 'cadvisor'
dns_sd_configs:
- names:
- 'tasks.cadvisor'
type: 'A'
port: 8080
-
job_name: 'node-exporter'
dns_sd_configs:
- names:
- 'tasks.node-exporter'
type: 'A'
port: 9100
Based on Docker Host & Container Overviewby by uschtwill https://grafana.net/dashboards/395.
More info about the usage of this dashboard can be found in this repo
If you liked it, you may buy me a coffee.
Data source config
Collector config:
Upload an updated version of an exported dashboard.json file from Grafana
| Revision | Description | Created | |
|---|---|---|---|
| Download |
Docker
Easily monitor Docker with Grafana Cloud's out-of-the-box monitoring solution.
Learn more

