
OpenNMS Linux Node-level Performance Data
Grafana pendant for Node-Level Performance Data KSC graphs
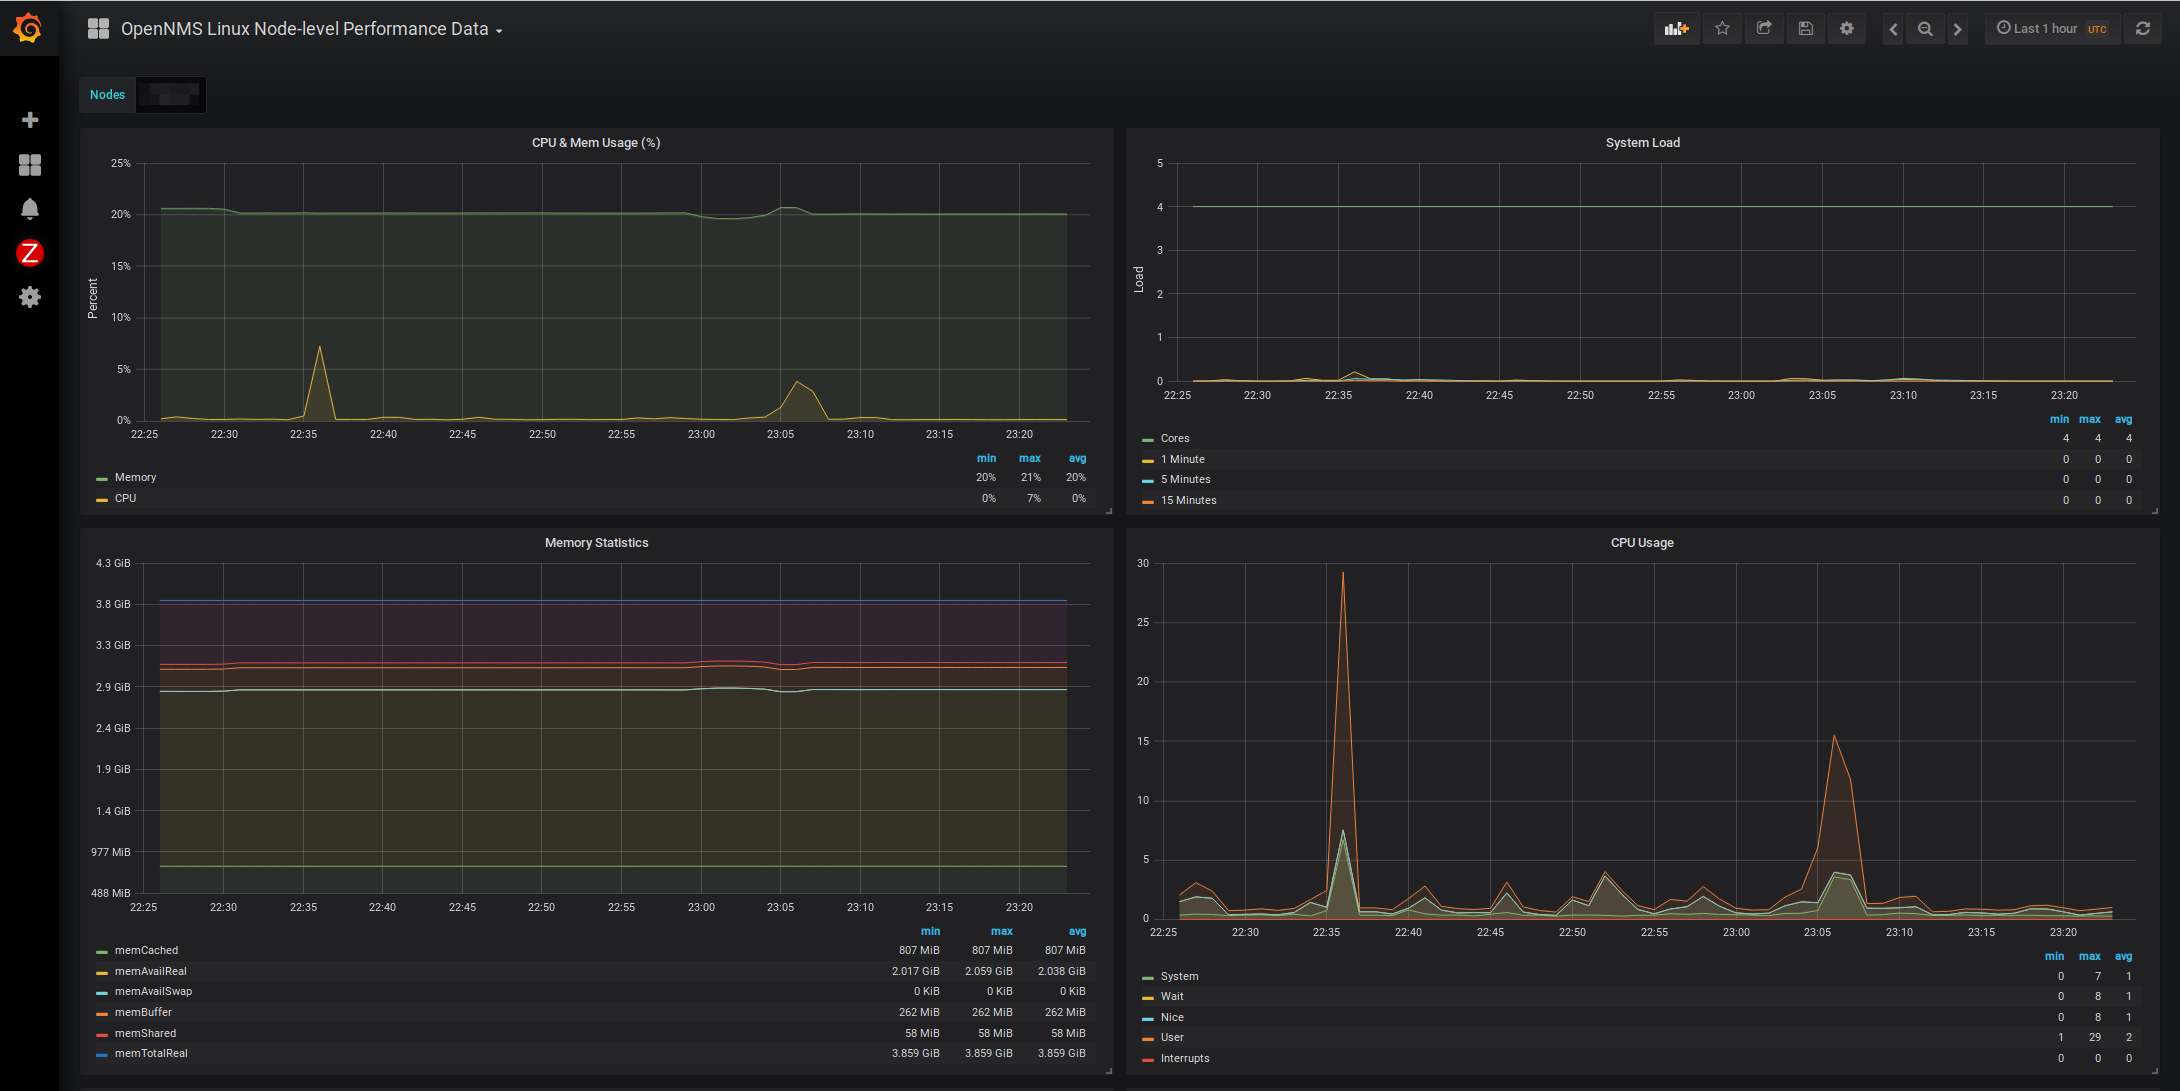
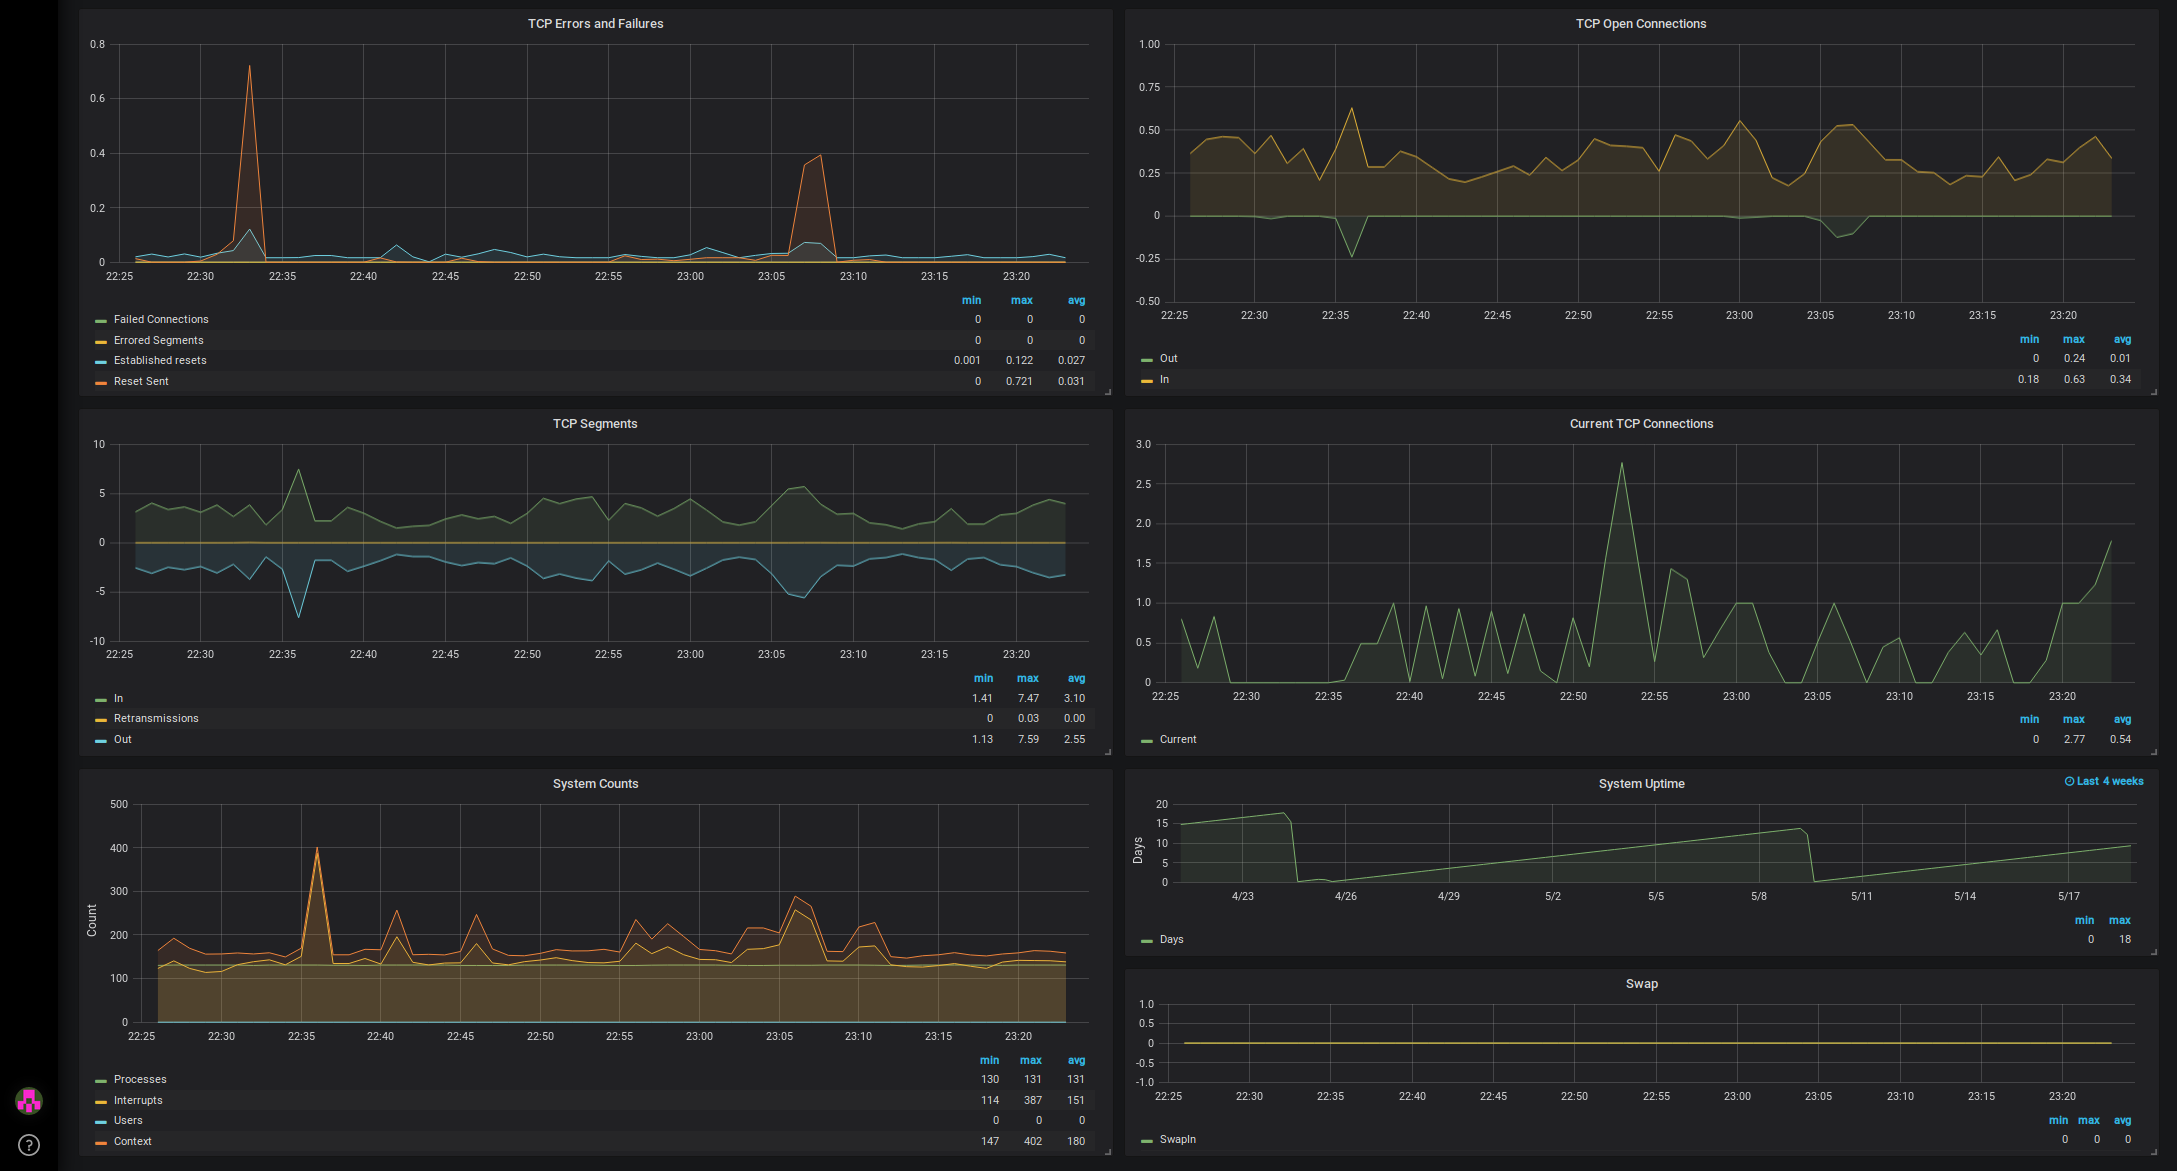
- See all Linux node metrics in one dashboard
- Nodes get selected by using the nodeFilter: nodeSysOID LIKE ‘.1.3.6.1.4.1.8072.3.2.10’ & serviceName like ‘SNMP’
- Memory statistics graph is configured to use the new memory definition. See here: https://askubuntu.com/questions/770108/what-do-the-changes-in-free-output-from-14-04-to-16-04-mean
- netsnmp 5.7.3 is required on client side because of ssCpuNumCpus metric for load graph
- Uptime graph is set to 4 weeks range to get an idea if reboots happend
If you find errors or have enhancements, feel free to create a pull request in our Github repo: https://github.com/opennms-forge/grafana-dashboards/tree/master/Linux-Performance-Node-Level
Data source config
Collector type:
Collector plugins:
Collector config:
Dashboard revisions
Upload an updated version of an exported dashboard.json file from Grafana
| Revision | Decscription | Created | |
|---|---|---|---|
| Download |
Sign up for Grafana Cloud

Get up and running in minutes with the Grafana Cloud free tier, which includes free forever 10k metrics, 50GB logs, 50GB traces, 500 VUh, and more.
Get this dashboard
Data source:
Dependencies: