
Trickster
Dashboard for Trickster delta cache for TSDBs
Trickster Grafana dashboard
Updated to work with the latest release!
More info in documentation
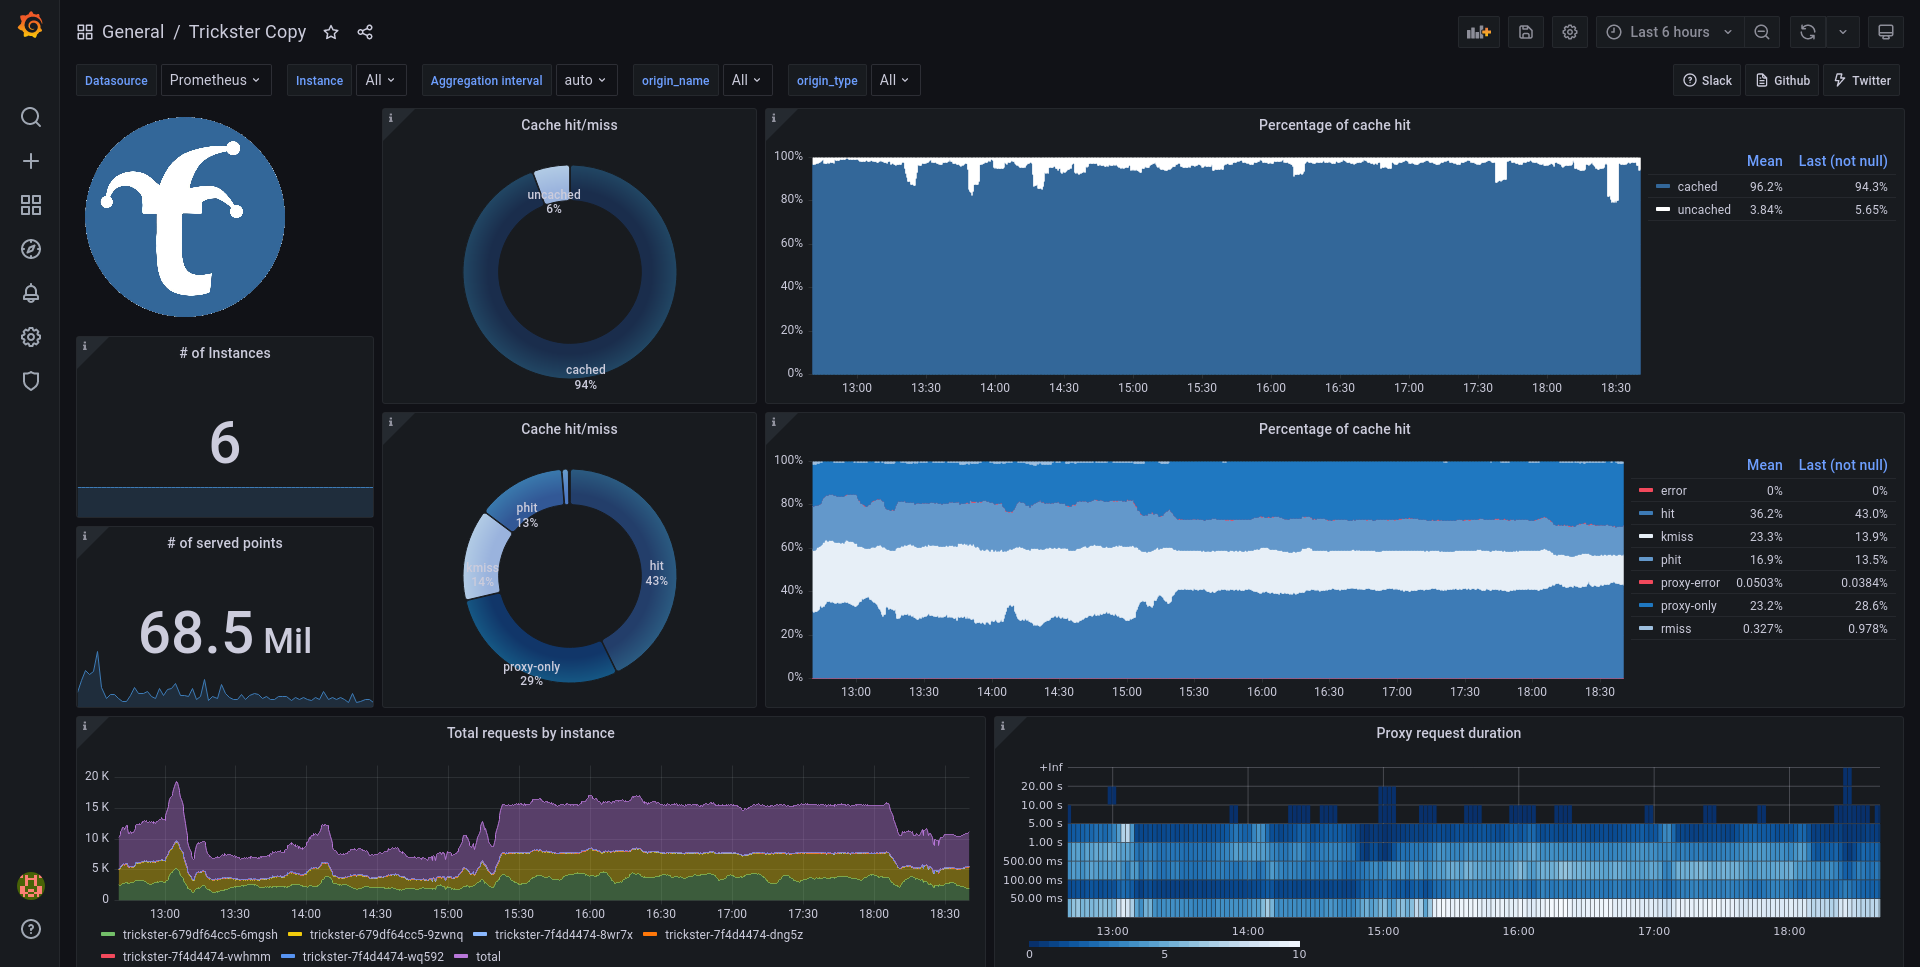
I made this dashboard as tool to benchmark and test Trickster delta cache for time-series databases. It should speed-up loading of your frequently viewed dashboards.
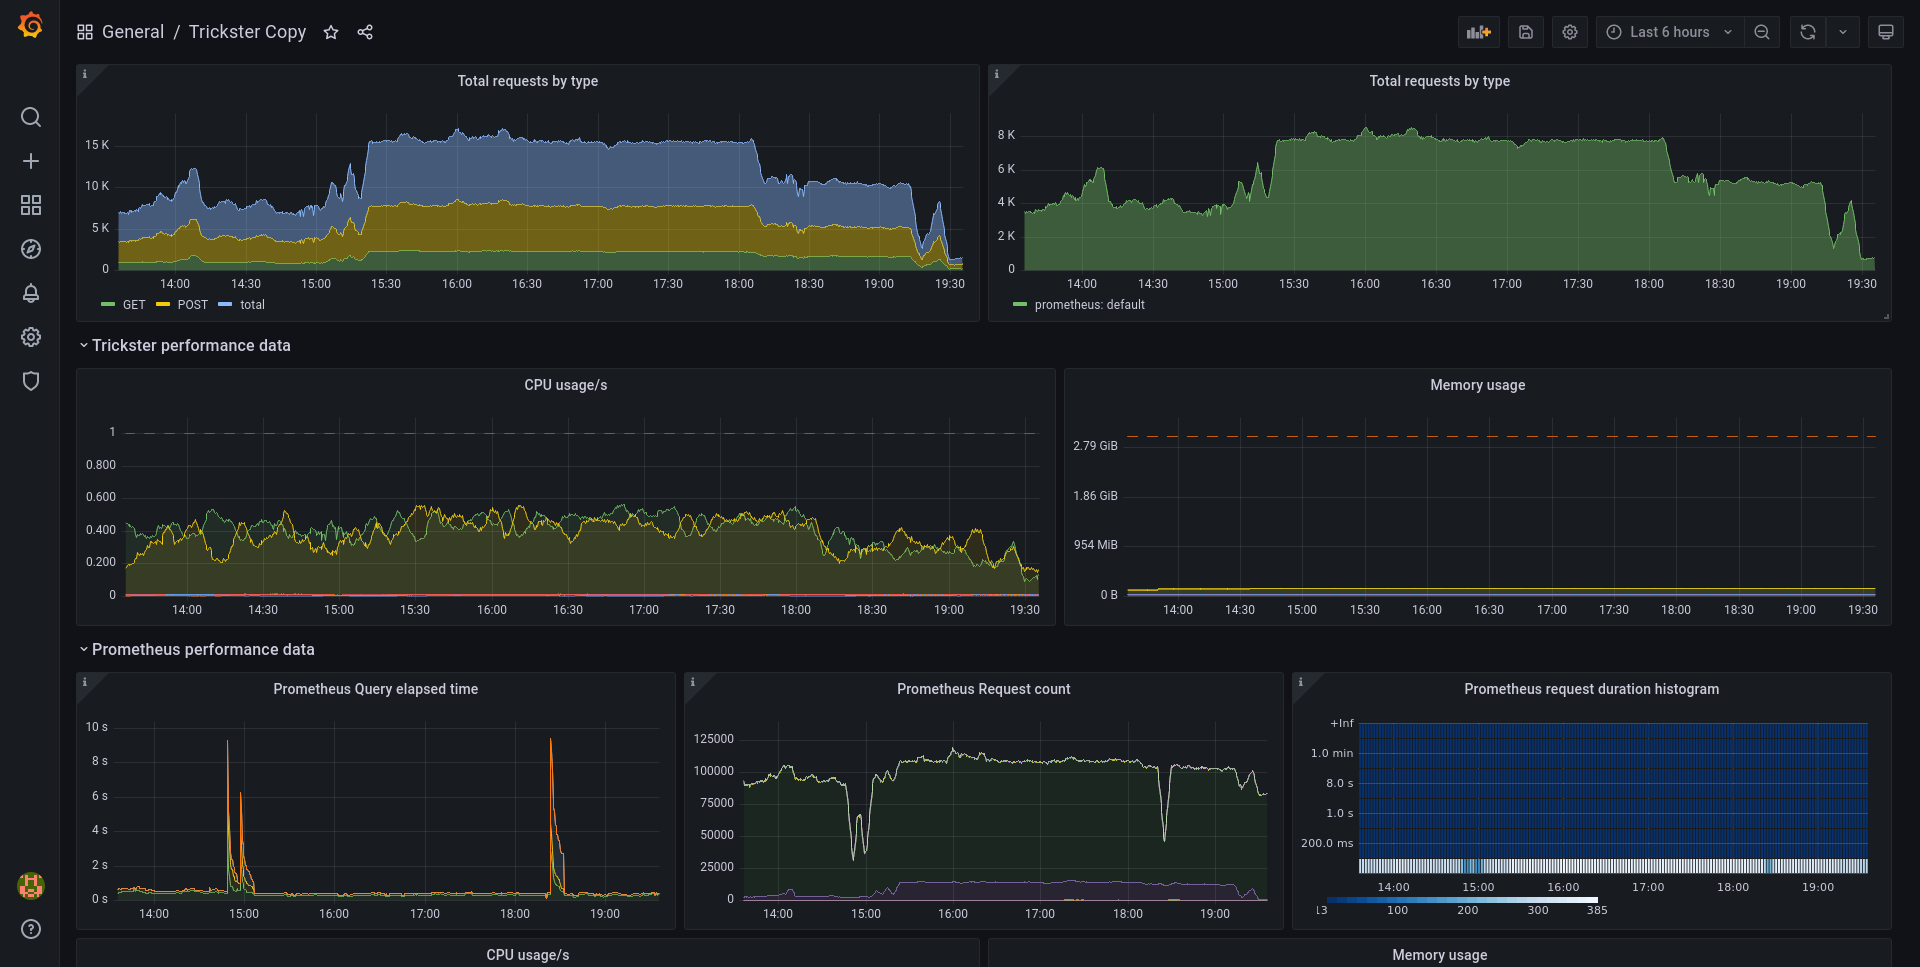
This dashboard should give you good idea about how is Trickster effective in caching, it’s utilization and possibility to observe possible impacts on time-series databases behind it (currently only Prometheus).
Description
This dashboard uses those metric sources:
- Trickster’s own metrics (for most of the important data)
- Prometheus own metrics (for observing impact on Prometheus)
- KubeStateMetrics (those are used only for resources limits display. This is Kubernetes specific you can override this by putting static values you use)
Every graph should have description tooltip on the upper left cornet if you hover over it.
Requirements
Datasource
- Prometheus datasource (this can be directly datasource leading to Prometheus instance or the Trickster itself if you like recursion :)
Variables
To identify Trickster and Prometheus metrics dashboard needs you to specify label and it’s value identifying their metrics. Those variables are:
- trickster_label_name - name of the label identifying Trickster metrics (e.g.
app) - trickster_label_value - value of the label identifying Trickster metrics (e.g.
trickster) - prometheus_label_name - name of the label identifying Prometheus metrics (e.g.
job) - prometheus_label_value - value of the label identifying Prometheus metrics (e.g.
prometheus)
Values can be regex matchers such as
prometheus.*
Data source config
Collector config:
Dashboard revisions
Upload an updated version of an exported dashboard.json file from Grafana
| Revision | Decscription | Created | |
|---|---|---|---|
| Download |
Get this dashboard
Data source:
Dependencies: