Internal Grafana Stats
You can configure Grafana to push internal metrics to Graphite. This dashboard supports Grafana version 3.1 to 4.5.1.
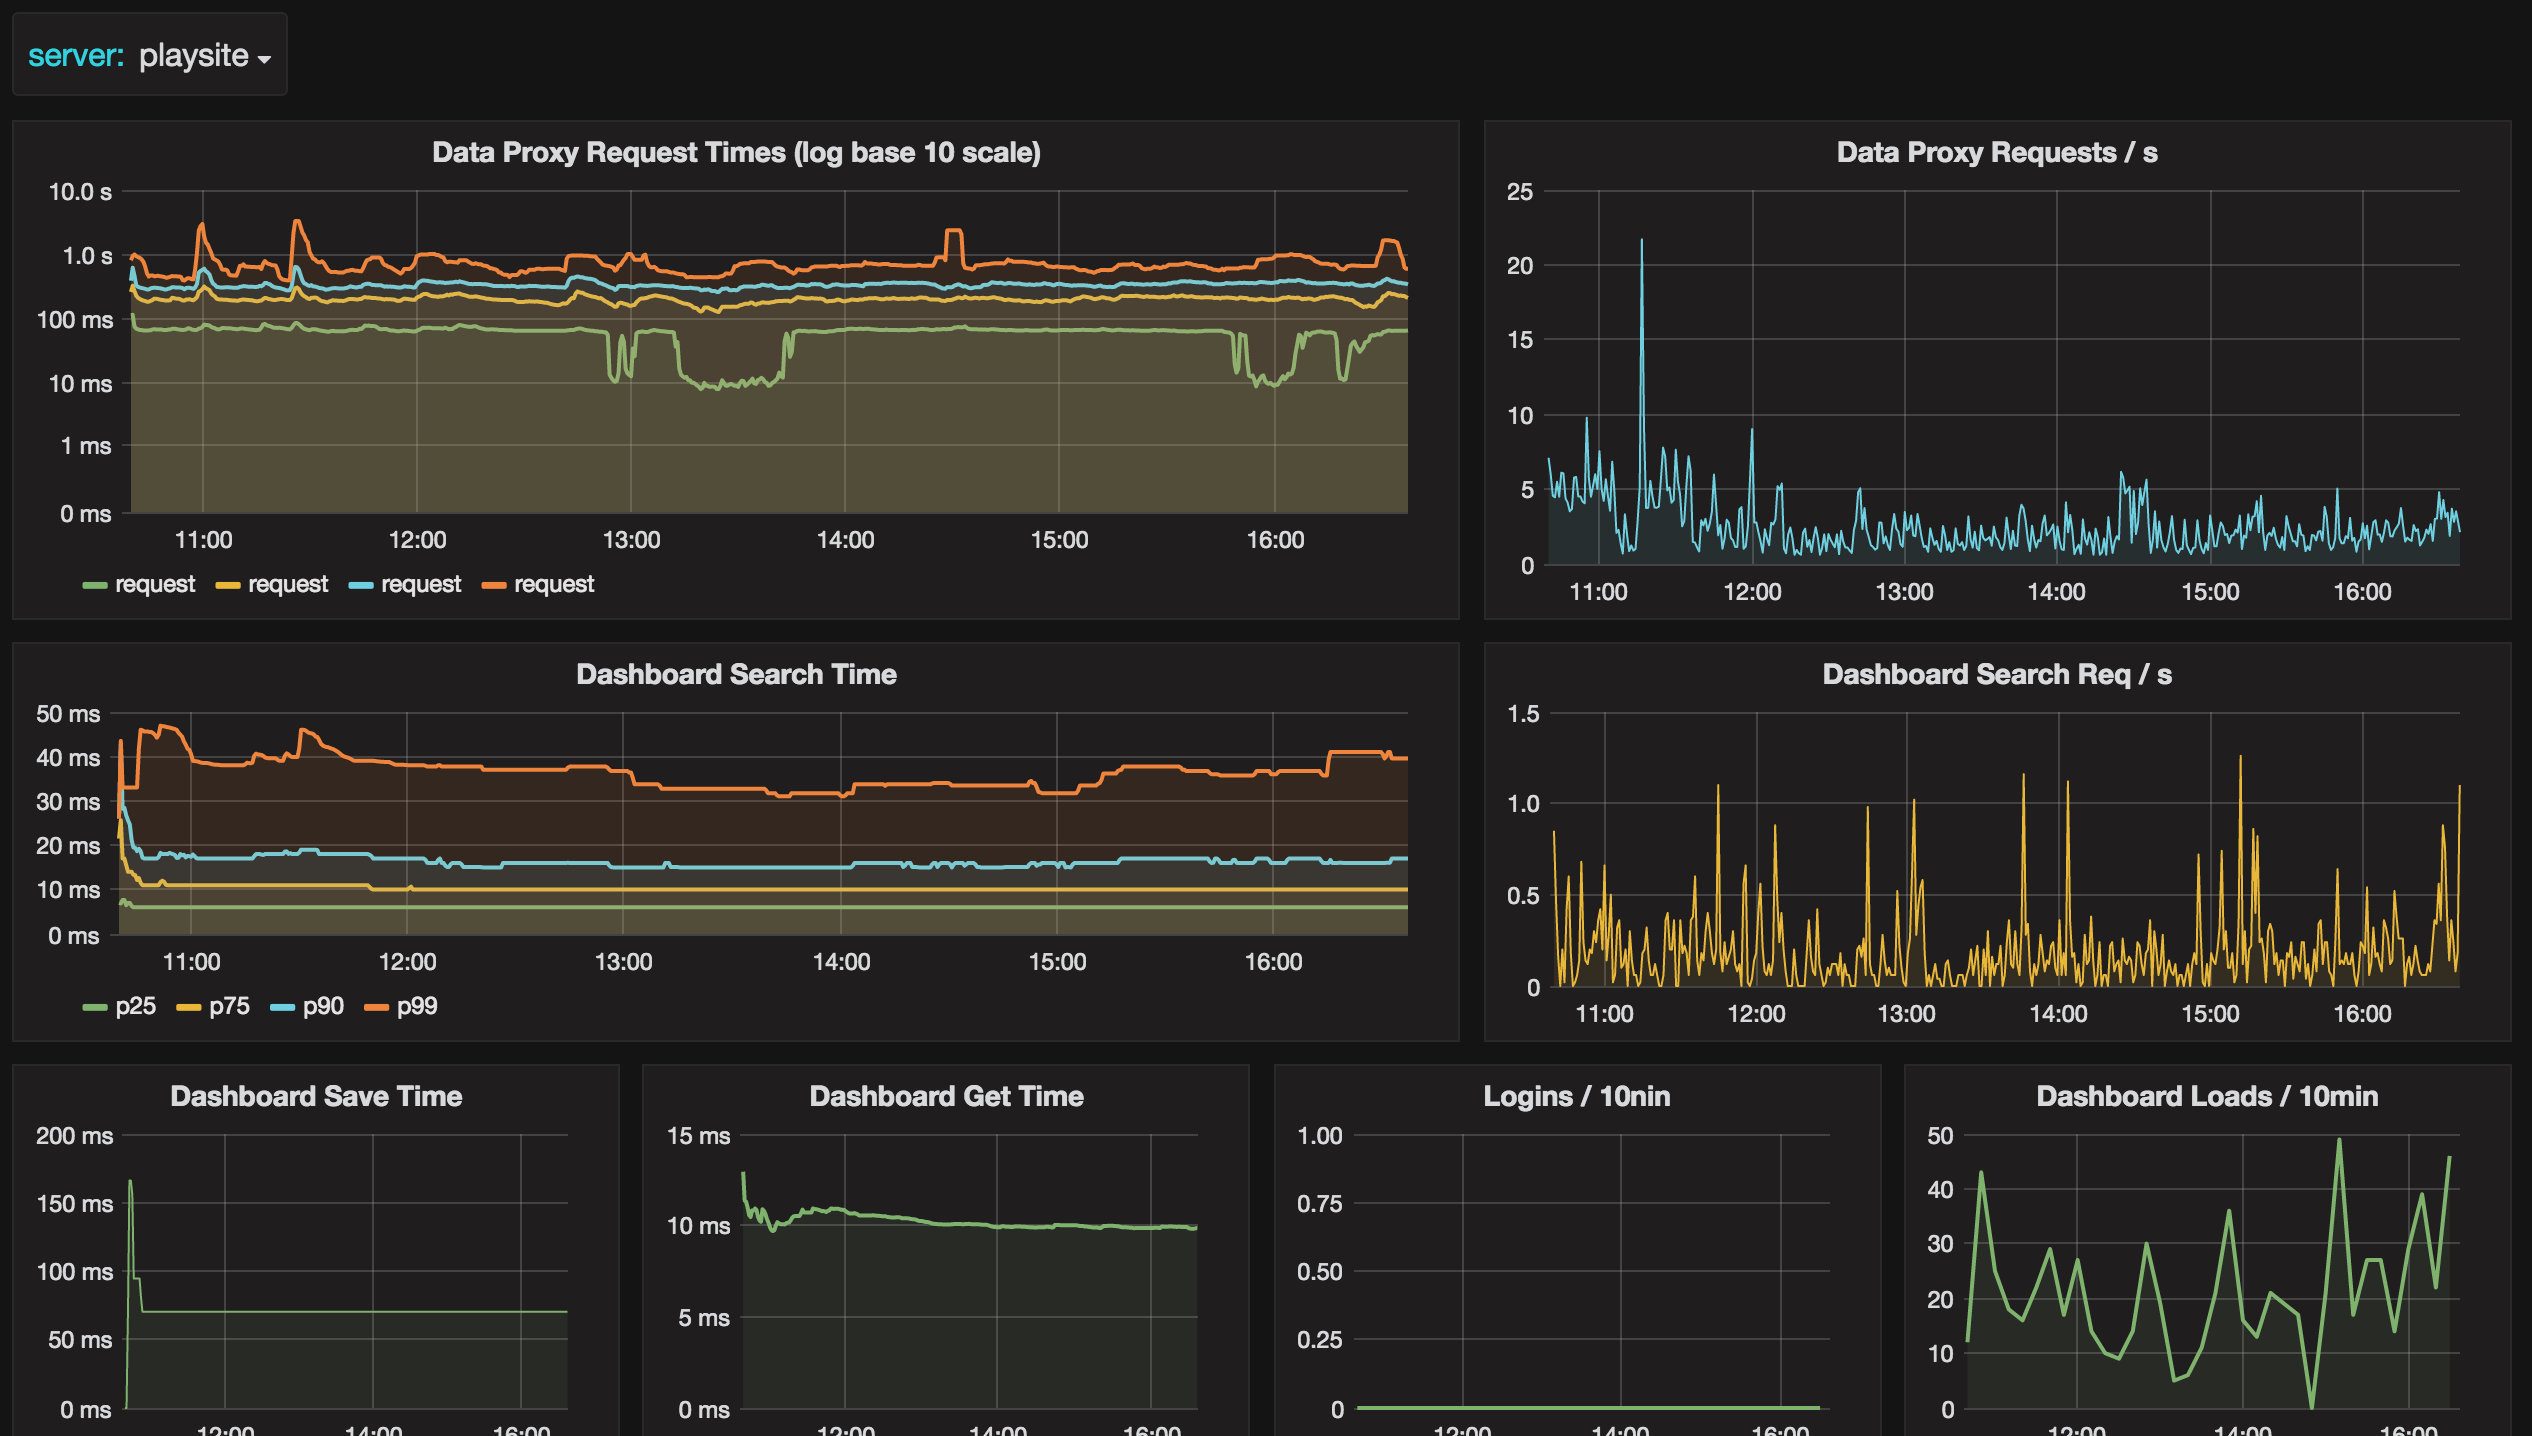
Metrics shown in dashboard
- Data proxy request times as percentiles
- Data proxy requests / s
- Dashboard search times, load / save
- Logins
Enable Grafana Metrics
[metrics]
enabled           = true
interval_seconds  = 60
[metrics.graphite]
address = localhost:2003
prefix = prod.grafana.%(instance_name)s.
instance_name is a new config option, if it's not present in your grafana.ini it will default to your server name.
Importing
During import you will be asked to specify you Grafana Metrics Prefix. Specify what you entered as prefix in your grafana.ini, but
do not include the instance_name. So if you use the example above specify prod.grafana (without trailing dot). You need to have an instance name in your prefix config option as this dashboards assumes the following metric paths $prefix.$server.
Make it better
For feedback and ideas to improve this dashboard please open an issue here: https://github.com/torkelo/dashboards
Data source config
Collector config:
Upload an updated version of an exported dashboard.json file from Grafana
| Revision | Description | Created | |
|---|---|---|---|
| Download |