Apache JMeter Dashboard using Core InfluxdbBackendListenerClient
Monitor your Apache JMeter load test in real time with InfluxDB and Grafana. Get overall summary, errors details and particular transaction response times.
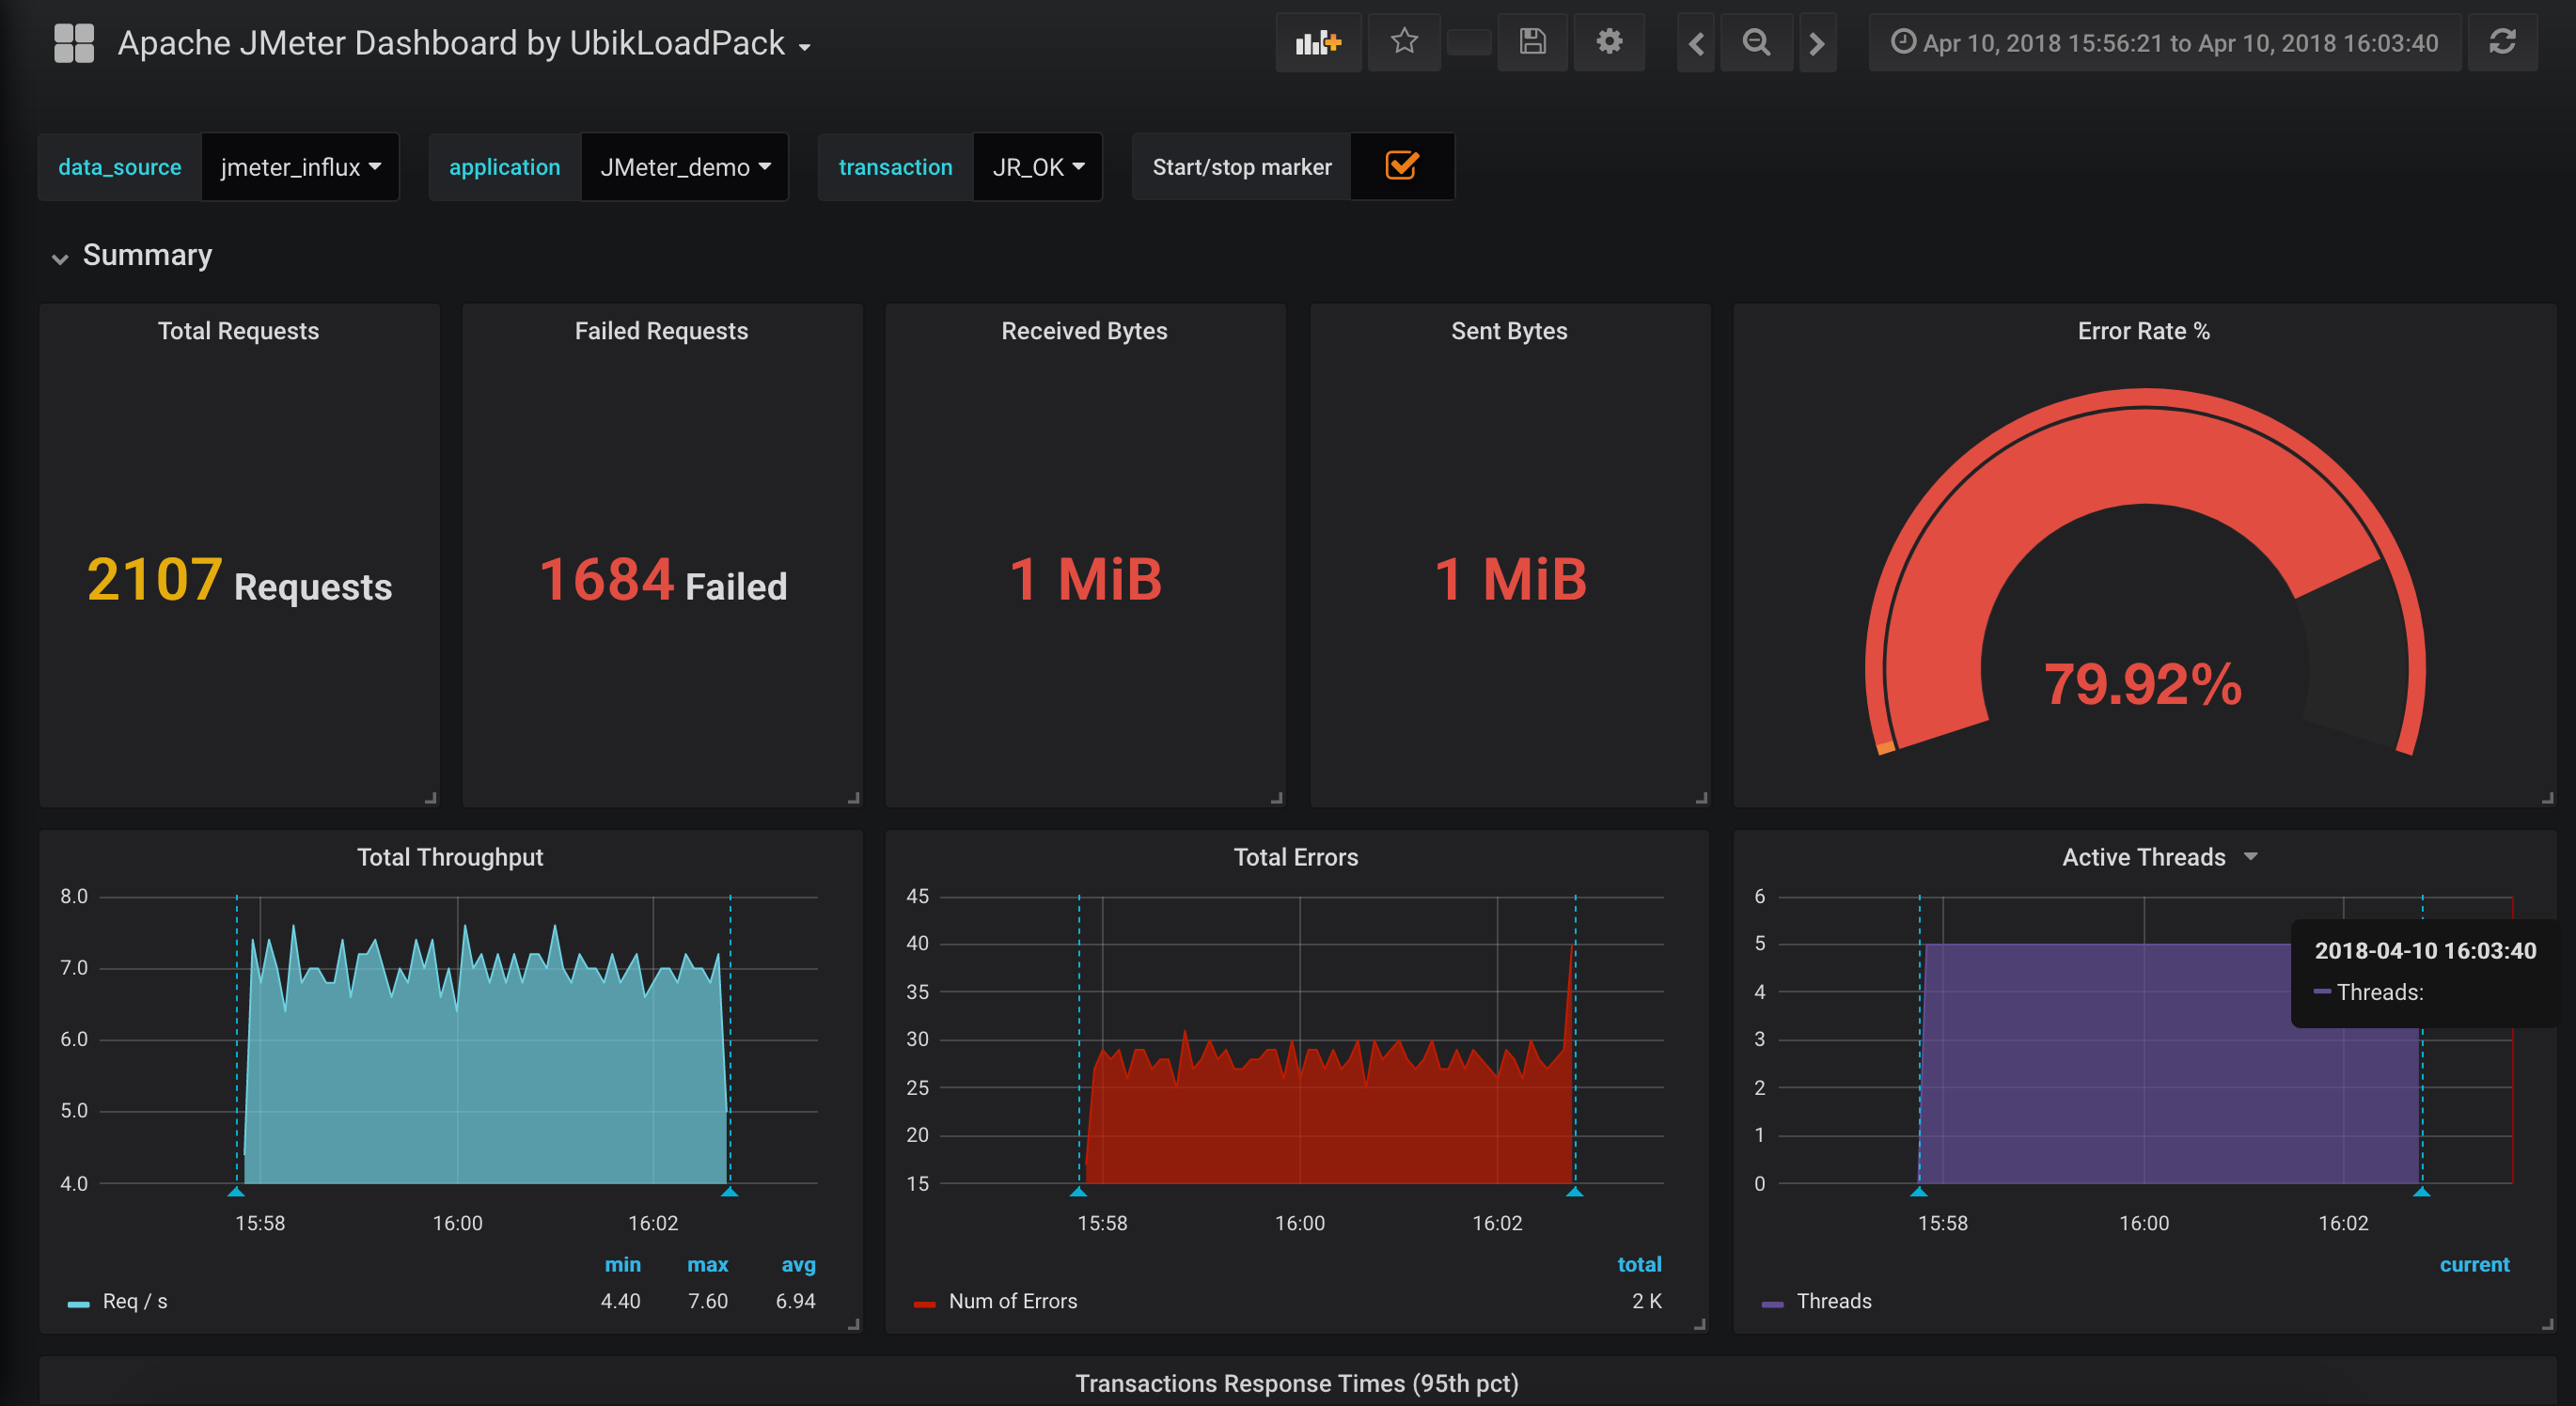
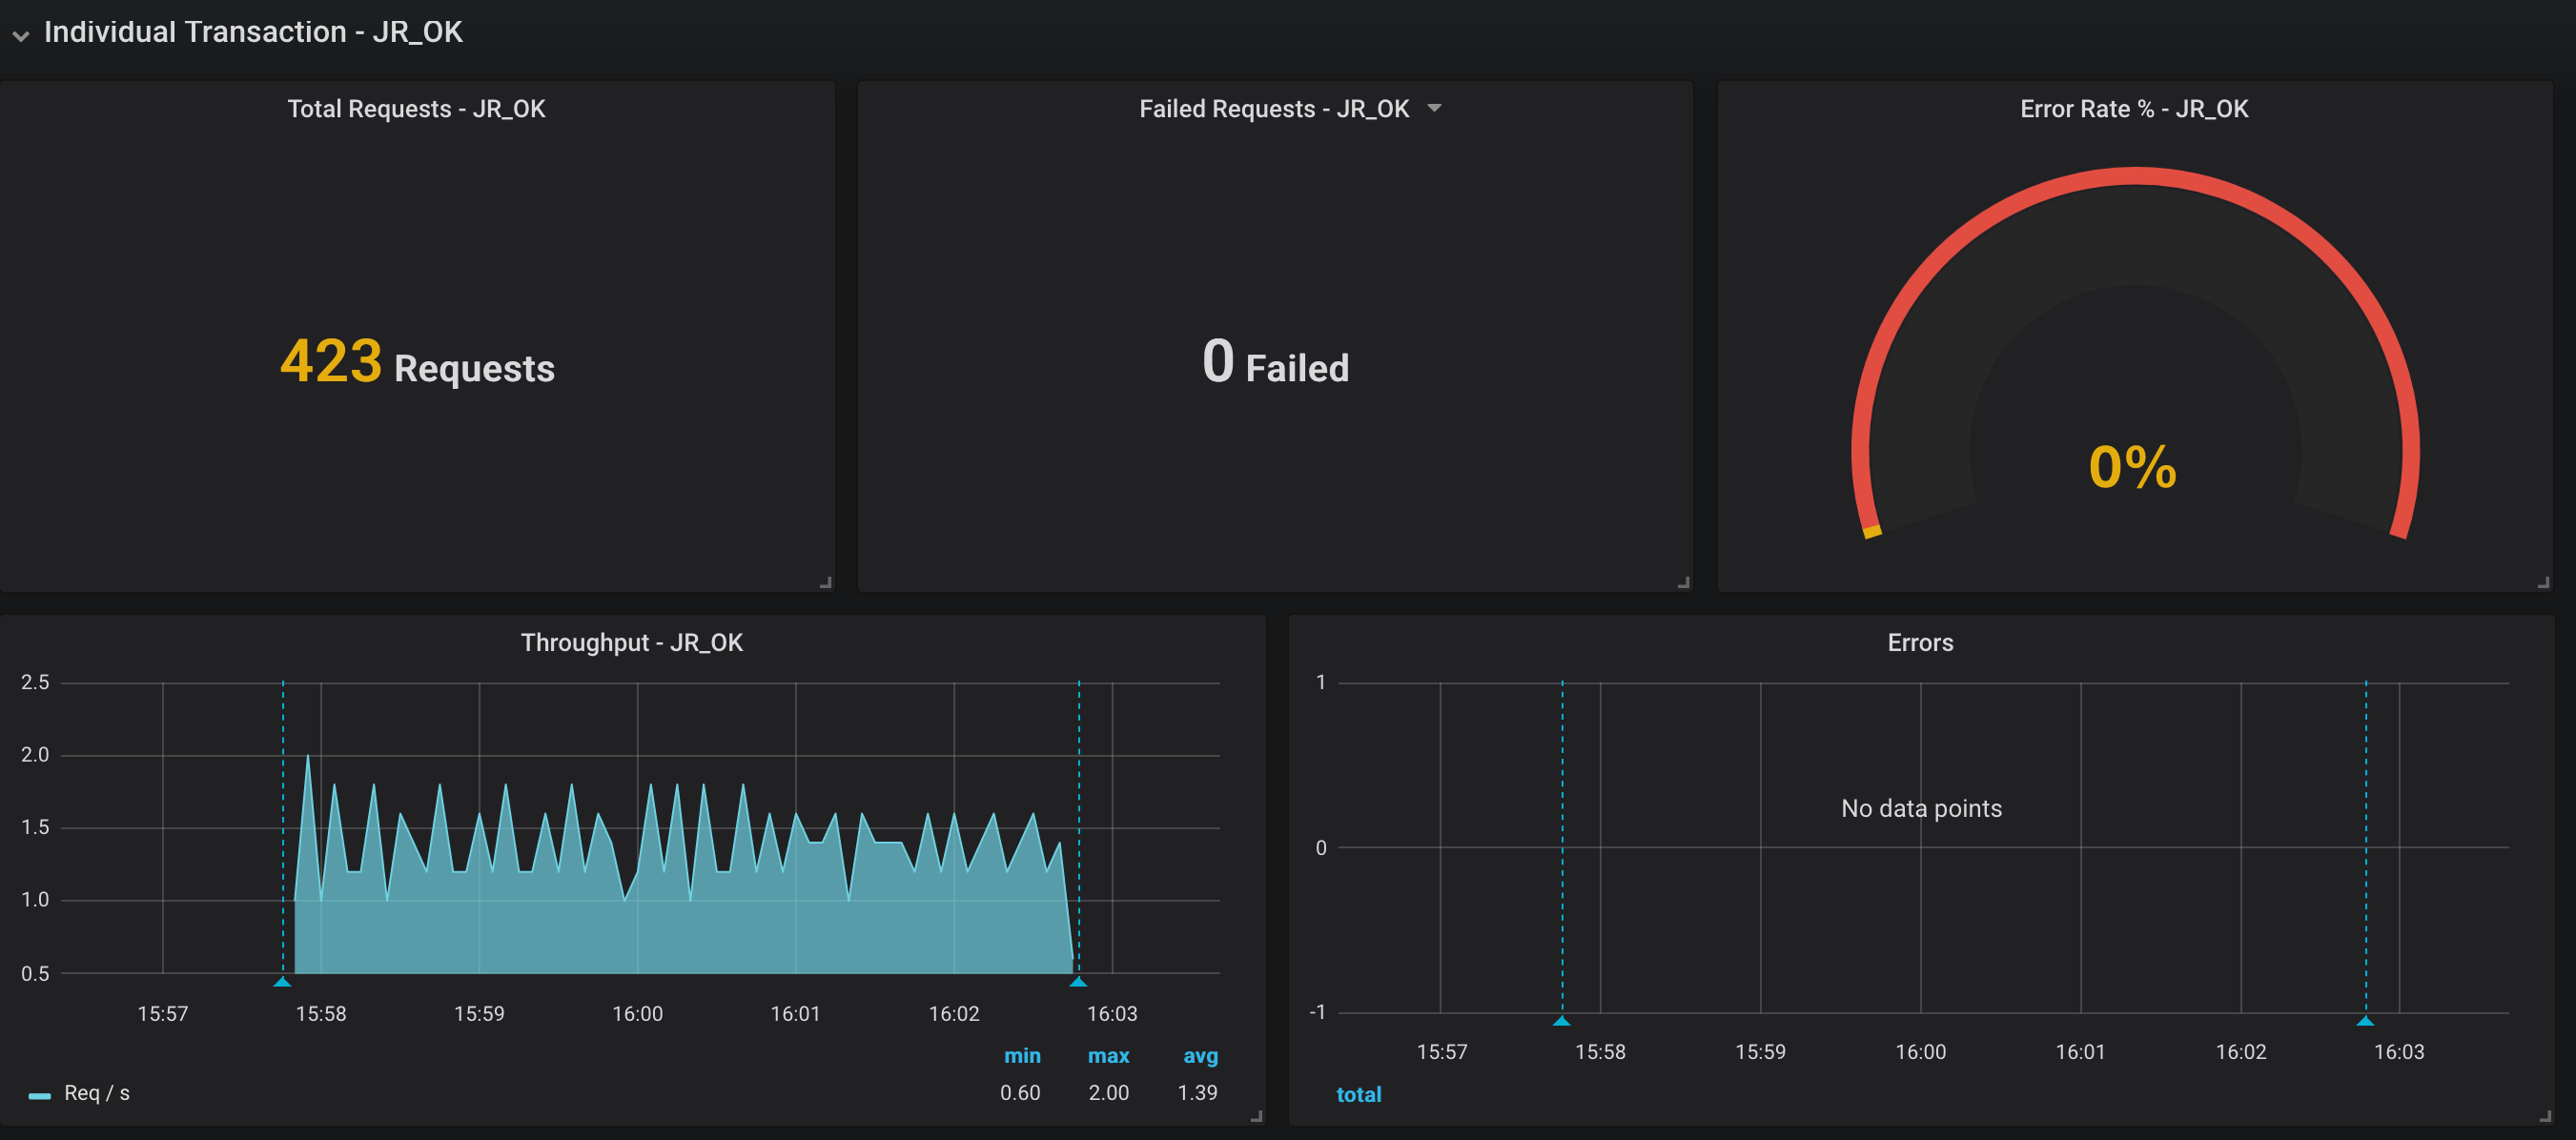
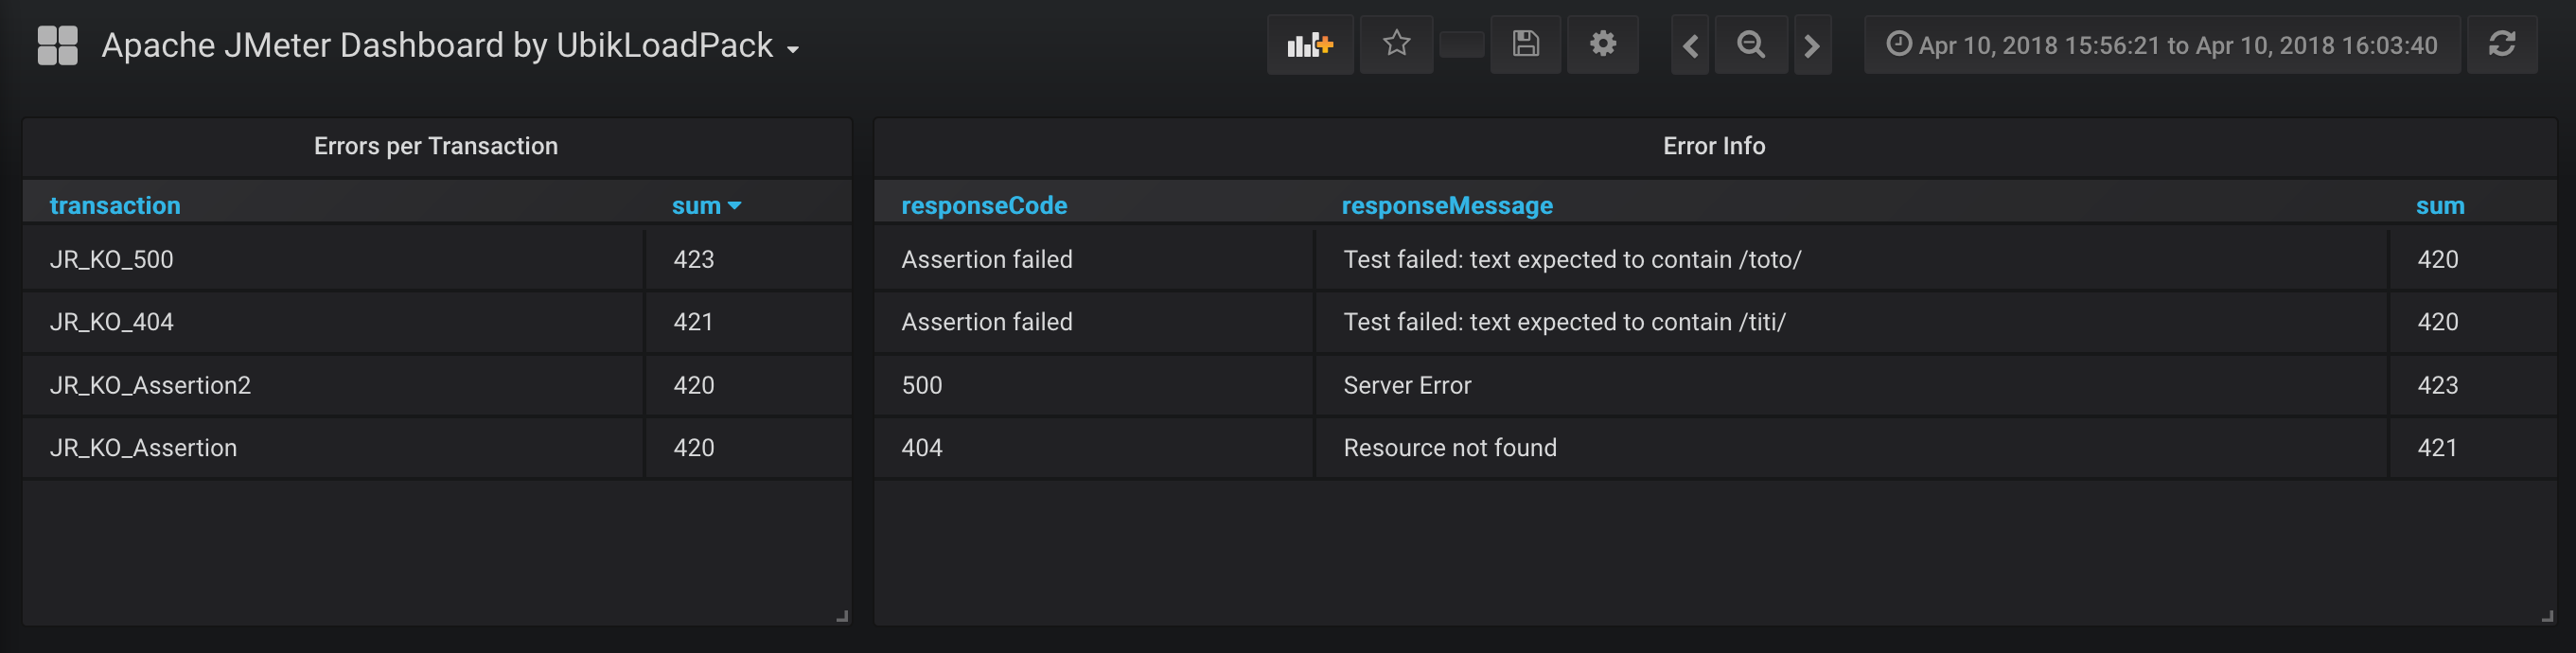
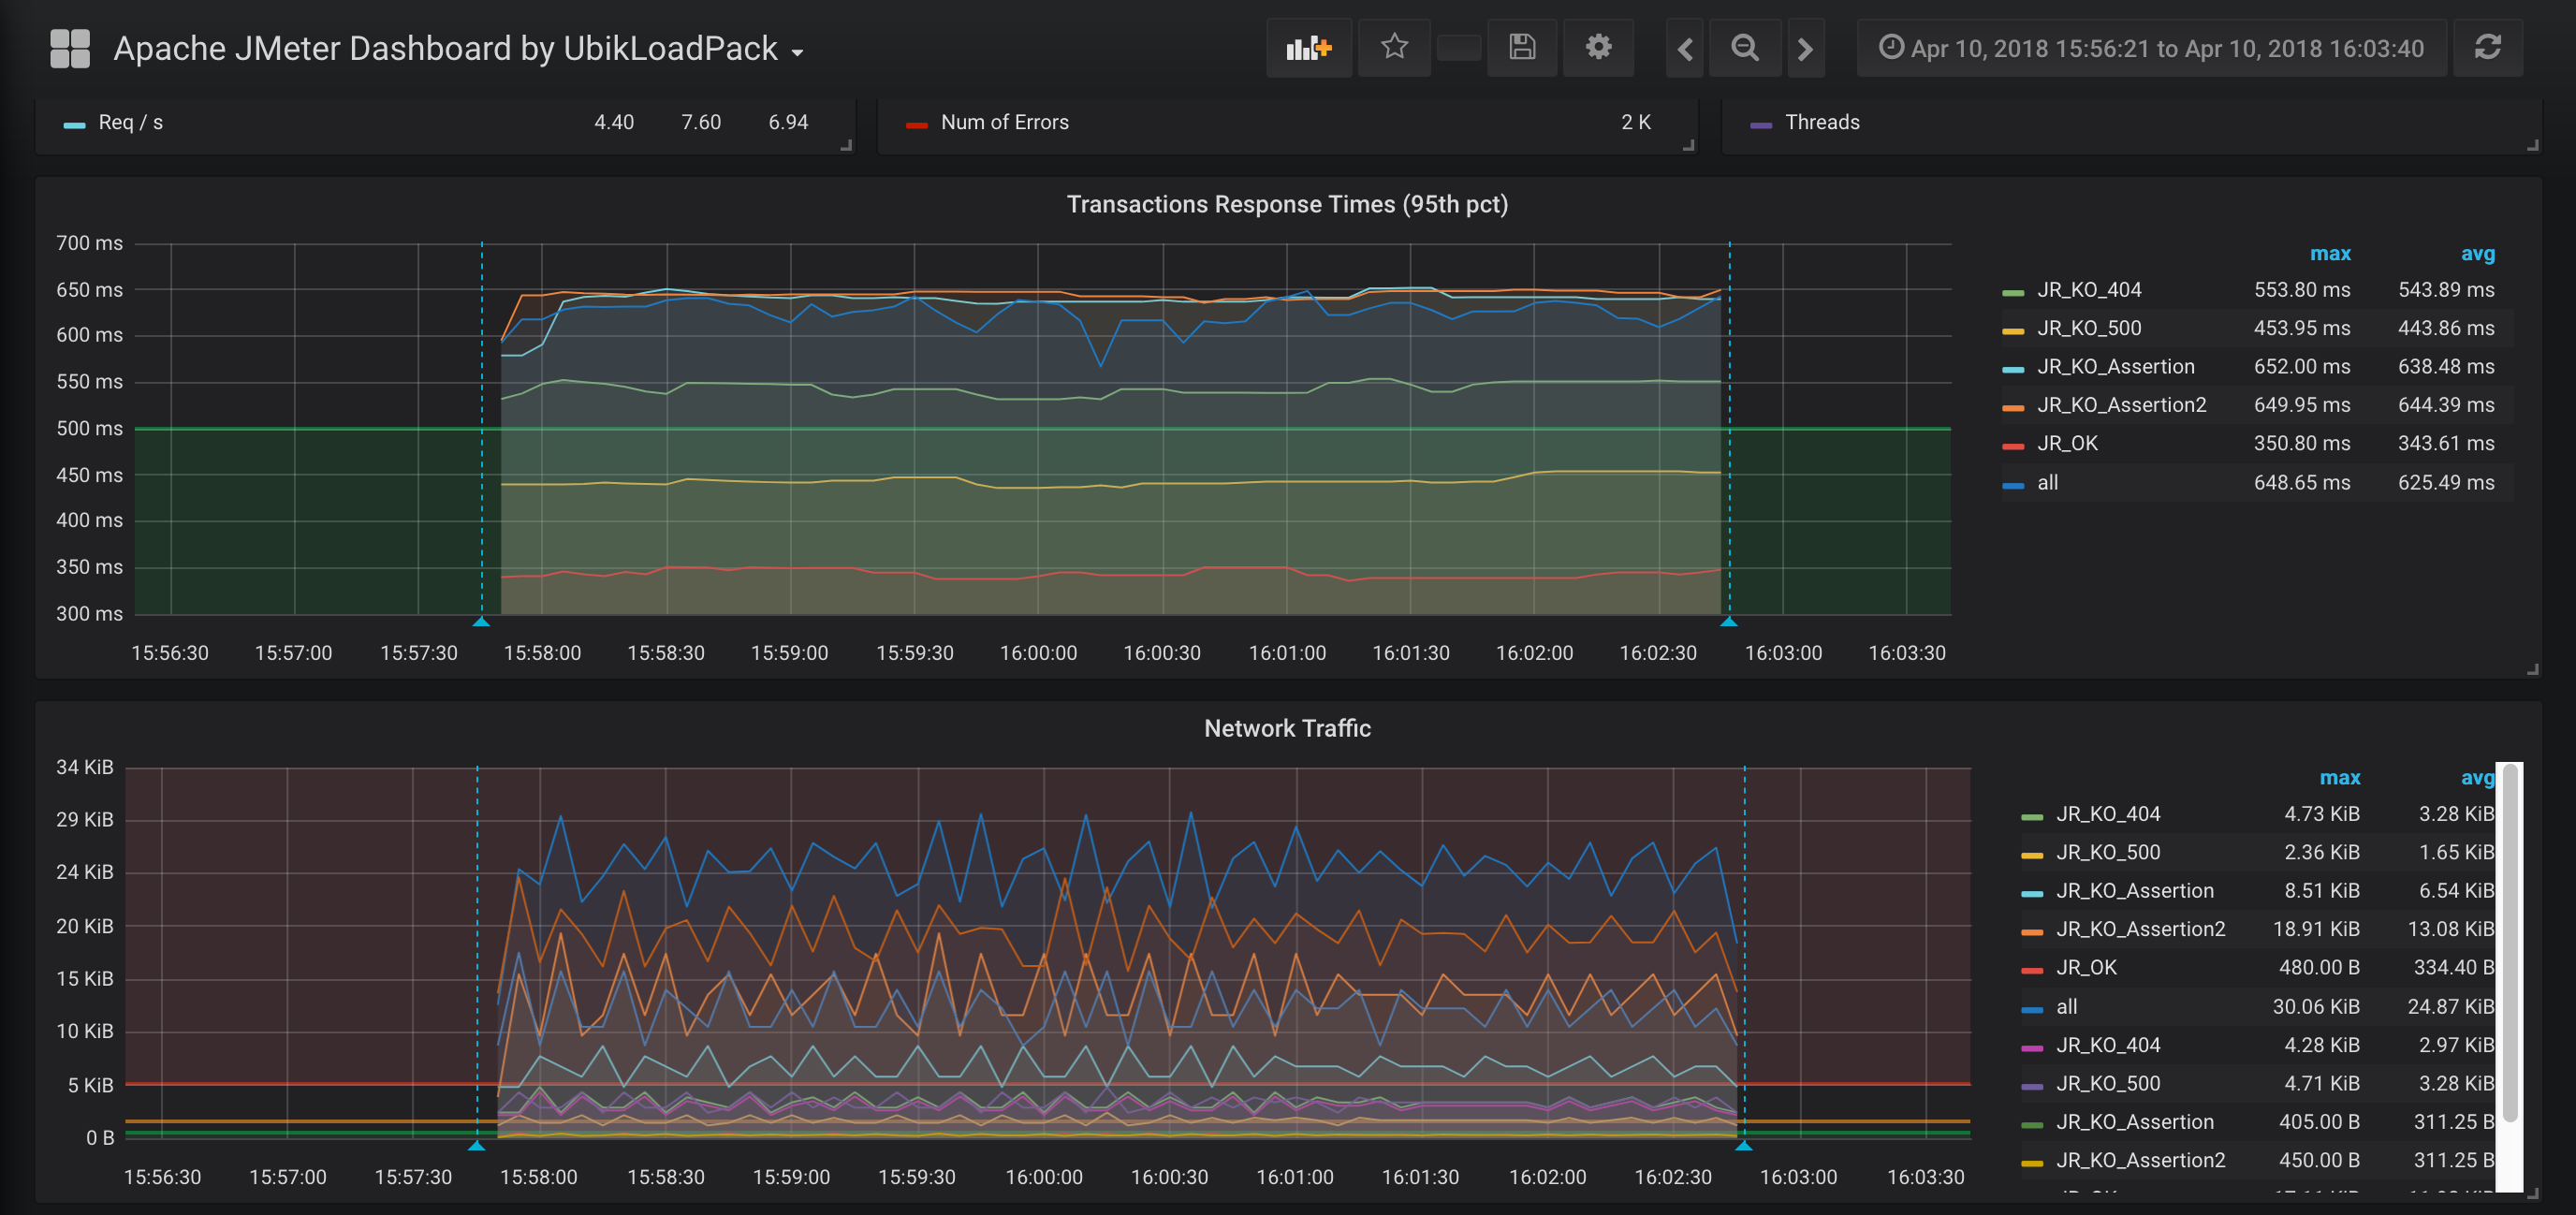
This dashboard requires Apache JMeter 5 and upper versions. It shows overall statistics and you can zoom on one particular transaction. In order to use it you need to use JMeter Backend Listener and select InfluxdbBackendListenerClient.
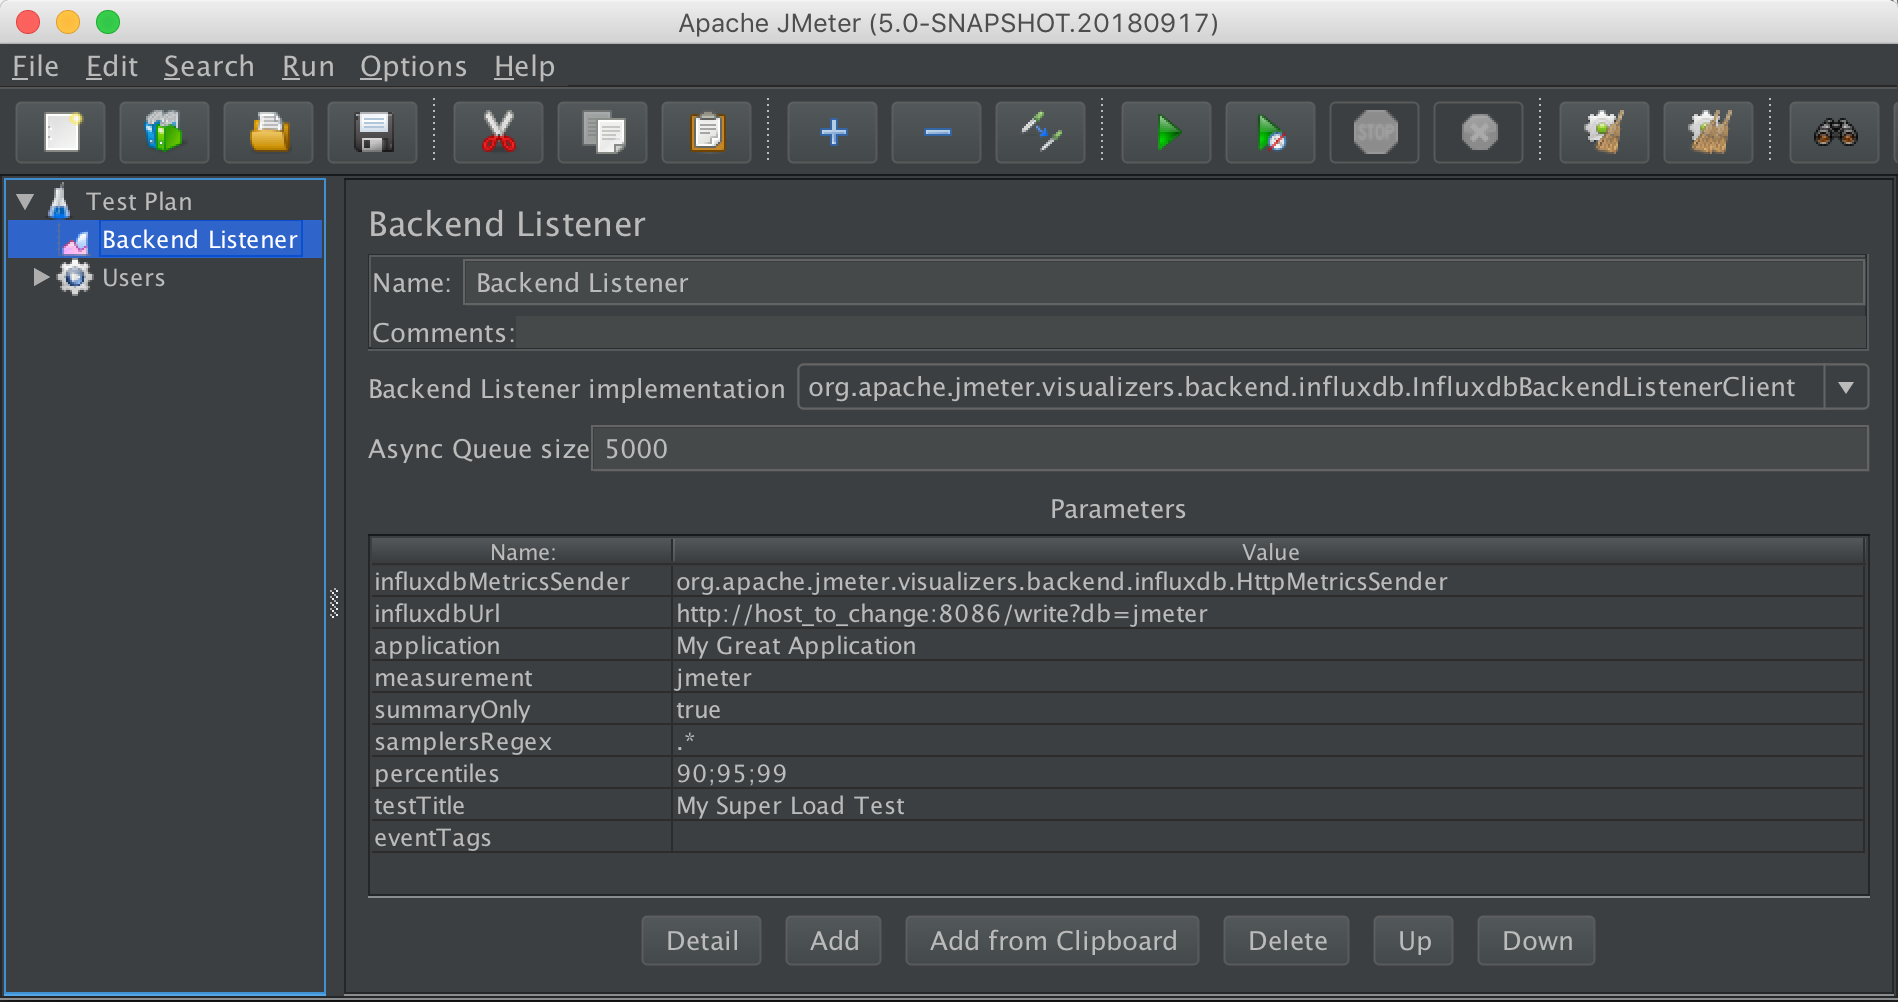
Setup:
- Add Backend Listener to your test plan (Add -> Listener -> Backend Listener) and select org.apache.jmeter.visualizers.backend.influxdb.HttpMetricsSender
- Provide in the Parameters table the InfluxDB settings, provide a name for the test, and specify which samplers to record.
For more details, see this :
- https://jmeter.apache.org/usermanual/component_reference.html#Backend_Listener
- https://jmeter.apache.org/usermanual/realtime-results.html
Enjoy ! UbikLoadPack Team
Data source config
Collector type:
Collector plugins:
Collector config:
Revisions
Upload an updated version of an exported dashboard.json file from Grafana
| Revision | Description | Created | |
|---|---|---|---|
| Download |